Immigrants from Philippines vs Seminole Householder Income Ages 25 - 44 years
COMPARE
Immigrants from Philippines
Seminole
Householder Income Ages 25 - 44 years
Householder Income Ages 25 - 44 years Comparison
Immigrants from Philippines
Seminole
$102,910
HOUSEHOLDER INCOME AGES 25 - 44 YEARS
99.0/ 100
METRIC RATING
84th/ 347
METRIC RANK
$76,584
HOUSEHOLDER INCOME AGES 25 - 44 YEARS
0.0/ 100
METRIC RATING
329th/ 347
METRIC RANK
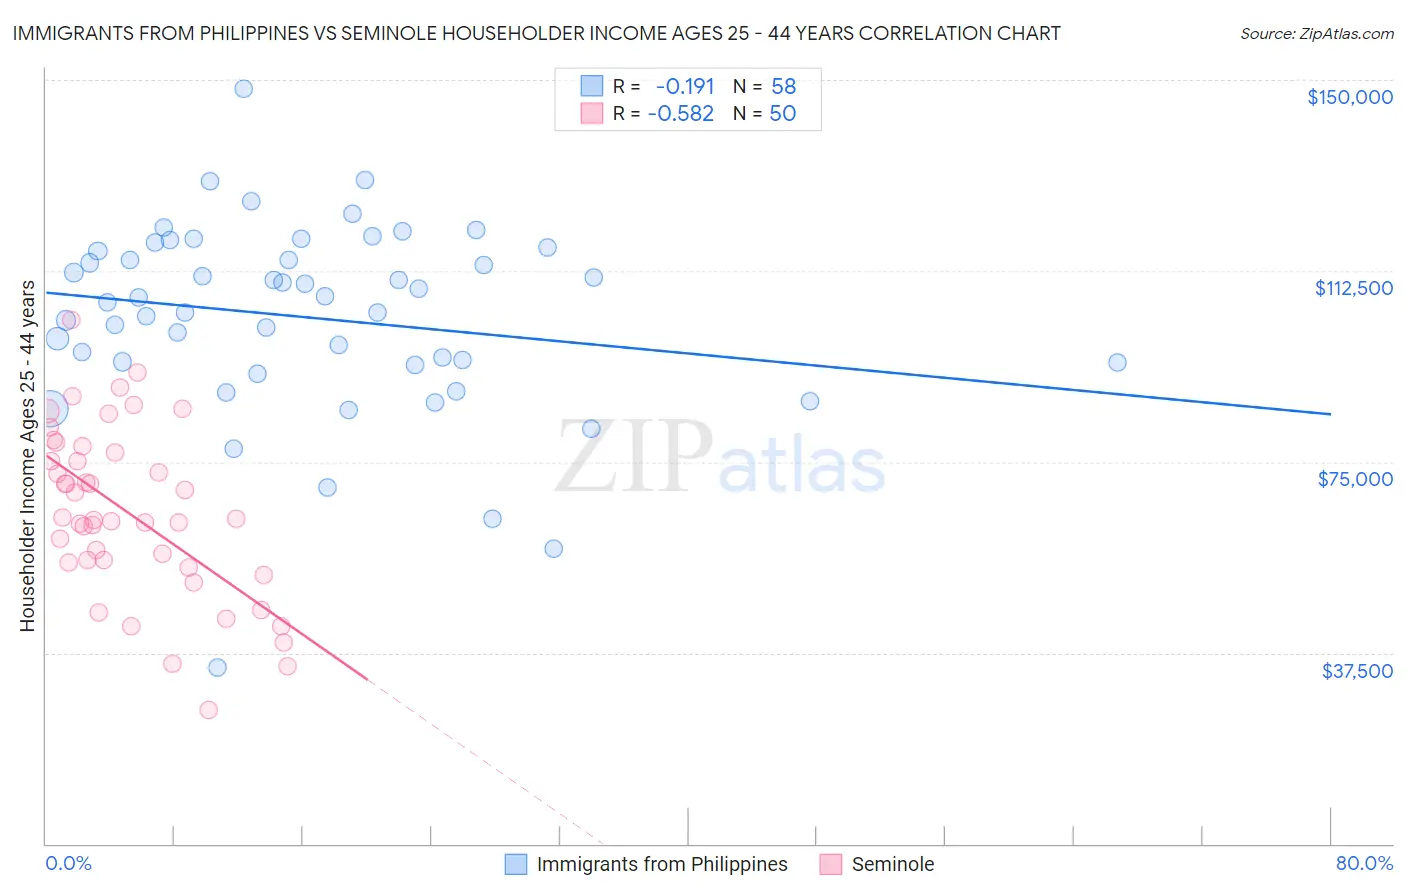
Immigrants from Philippines vs Seminole Householder Income Ages 25 - 44 years Correlation Chart
The statistical analysis conducted on geographies consisting of 469,744,138 people shows a poor negative correlation between the proportion of Immigrants from Philippines and household income with householder between the ages 25 and 44 in the United States with a correlation coefficient (R) of -0.191 and weighted average of $102,910. Similarly, the statistical analysis conducted on geographies consisting of 118,219,857 people shows a substantial negative correlation between the proportion of Seminole and household income with householder between the ages 25 and 44 in the United States with a correlation coefficient (R) of -0.582 and weighted average of $76,584, a difference of 34.4%.
Householder Income Ages 25 - 44 years Correlation Summary
| Measurement | Immigrants from Philippines | Seminole |
| Minimum | $34,643 | $26,250 |
| Maximum | $148,401 | $102,754 |
| Range | $113,758 | $76,504 |
| Mean | $103,402 | $65,024 |
| Median | $106,816 | $63,631 |
| Interquartile 25% (IQ1) | $94,583 | $55,292 |
| Interquartile 75% (IQ3) | $116,347 | $76,875 |
| Interquartile Range (IQR) | $21,764 | $21,583 |
| Standard Deviation (Sample) | $19,015 | $16,561 |
| Standard Deviation (Population) | $18,850 | $16,395 |
Similar Demographics by Householder Income Ages 25 - 44 years
Demographics Similar to Immigrants from Philippines by Householder Income Ages 25 - 44 years
In terms of householder income ages 25 - 44 years, the demographic groups most similar to Immigrants from Philippines are Argentinean ($103,111, a difference of 0.20%), South African ($103,160, a difference of 0.24%), Immigrants from Serbia ($103,155, a difference of 0.24%), Immigrants from Ukraine ($102,664, a difference of 0.24%), and Immigrants from Hungary ($102,655, a difference of 0.25%).
| Demographics | Rating | Rank | Householder Income Ages 25 - 44 years |
| Immigrants | Southern Europe | 99.3 /100 | #77 | Exceptional $103,486 |
| Immigrants | Bulgaria | 99.3 /100 | #78 | Exceptional $103,423 |
| Armenians | 99.2 /100 | #79 | Exceptional $103,248 |
| Immigrants | Egypt | 99.2 /100 | #80 | Exceptional $103,192 |
| South Africans | 99.2 /100 | #81 | Exceptional $103,160 |
| Immigrants | Serbia | 99.2 /100 | #82 | Exceptional $103,155 |
| Argentineans | 99.1 /100 | #83 | Exceptional $103,111 |
| Immigrants | Philippines | 99.0 /100 | #84 | Exceptional $102,910 |
| Immigrants | Ukraine | 98.9 /100 | #85 | Exceptional $102,664 |
| Immigrants | Hungary | 98.9 /100 | #86 | Exceptional $102,655 |
| Immigrants | Western Europe | 98.9 /100 | #87 | Exceptional $102,654 |
| Immigrants | Canada | 98.9 /100 | #88 | Exceptional $102,616 |
| Romanians | 98.8 /100 | #89 | Exceptional $102,544 |
| Ukrainians | 98.8 /100 | #90 | Exceptional $102,451 |
| Croatians | 98.7 /100 | #91 | Exceptional $102,414 |
Demographics Similar to Seminole by Householder Income Ages 25 - 44 years
In terms of householder income ages 25 - 44 years, the demographic groups most similar to Seminole are Immigrants from Cuba ($76,701, a difference of 0.15%), Immigrants from Bahamas ($76,910, a difference of 0.42%), Yakama ($76,226, a difference of 0.47%), Houma ($77,044, a difference of 0.60%), and Sioux ($77,089, a difference of 0.66%).
| Demographics | Rating | Rank | Householder Income Ages 25 - 44 years |
| Chickasaw | 0.0 /100 | #322 | Tragic $77,929 |
| Immigrants | Honduras | 0.0 /100 | #323 | Tragic $77,328 |
| Dutch West Indians | 0.0 /100 | #324 | Tragic $77,260 |
| Sioux | 0.0 /100 | #325 | Tragic $77,089 |
| Houma | 0.0 /100 | #326 | Tragic $77,044 |
| Immigrants | Bahamas | 0.0 /100 | #327 | Tragic $76,910 |
| Immigrants | Cuba | 0.0 /100 | #328 | Tragic $76,701 |
| Seminole | 0.0 /100 | #329 | Tragic $76,584 |
| Yakama | 0.0 /100 | #330 | Tragic $76,226 |
| Natives/Alaskans | 0.0 /100 | #331 | Tragic $75,647 |
| Bahamians | 0.0 /100 | #332 | Tragic $75,395 |
| Hopi | 0.0 /100 | #333 | Tragic $75,002 |
| Creek | 0.0 /100 | #334 | Tragic $74,847 |
| Kiowa | 0.0 /100 | #335 | Tragic $74,776 |
| Yup'ik | 0.0 /100 | #336 | Tragic $73,688 |