Immigrants from Africa vs Ecuadorian 8th Grade
COMPARE
Immigrants from Africa
Ecuadorian
8th Grade
8th Grade Comparison
Immigrants from Africa
Ecuadorians
95.2%
8TH GRADE
2.7/ 100
METRIC RATING
237th/ 347
METRIC RANK
93.6%
8TH GRADE
0.0/ 100
METRIC RATING
308th/ 347
METRIC RANK
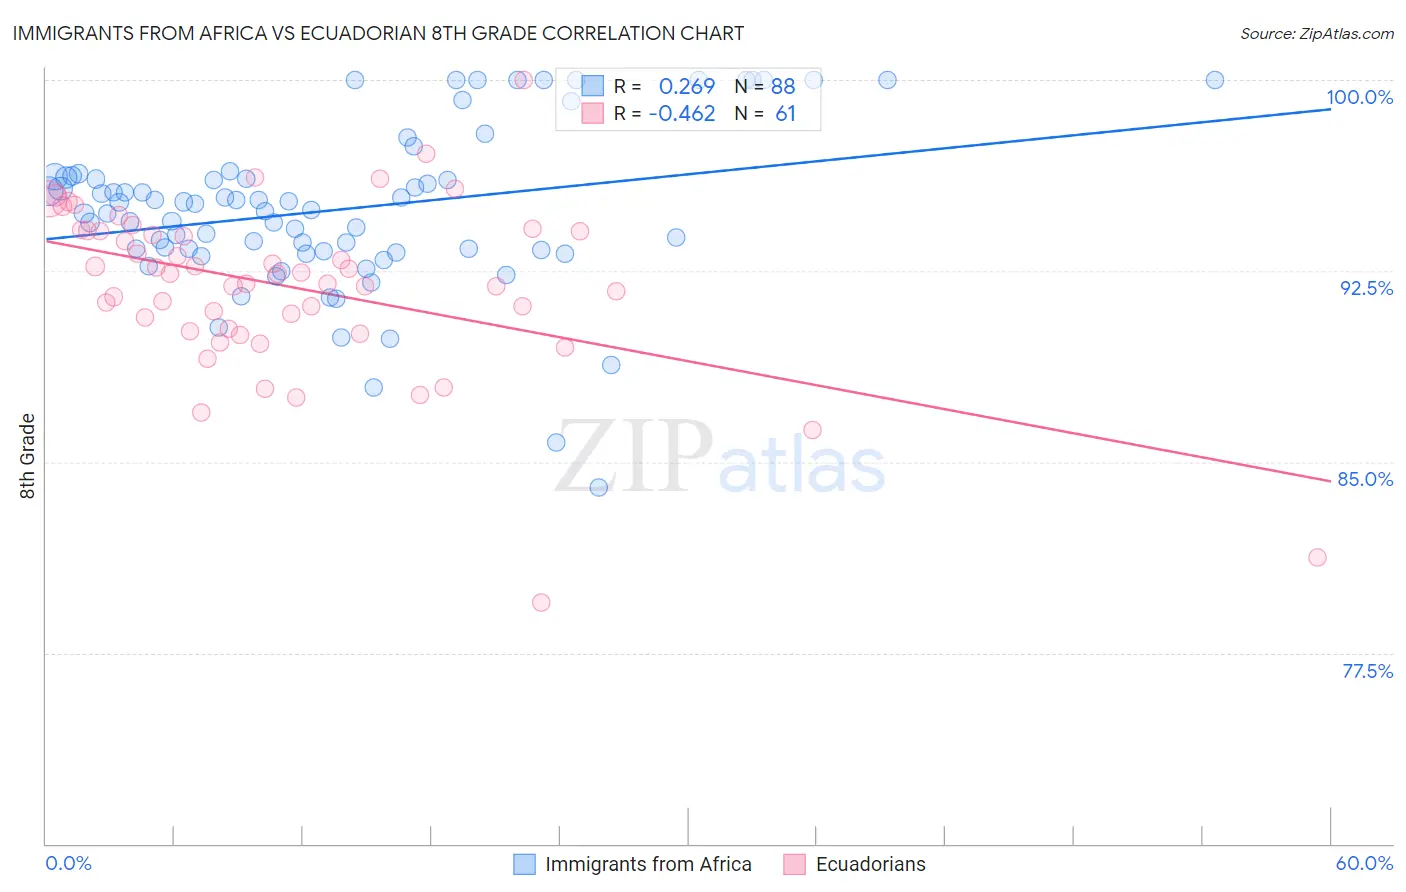
Immigrants from Africa vs Ecuadorian 8th Grade Correlation Chart
The statistical analysis conducted on geographies consisting of 469,408,495 people shows a weak positive correlation between the proportion of Immigrants from Africa and percentage of population with at least 8th grade education in the United States with a correlation coefficient (R) of 0.269 and weighted average of 95.2%. Similarly, the statistical analysis conducted on geographies consisting of 317,753,005 people shows a moderate negative correlation between the proportion of Ecuadorians and percentage of population with at least 8th grade education in the United States with a correlation coefficient (R) of -0.462 and weighted average of 93.6%, a difference of 1.7%.
8th Grade Correlation Summary
| Measurement | Immigrants from Africa | Ecuadorian |
| Minimum | 84.0% | 79.5% |
| Maximum | 100.0% | 100.0% |
| Range | 16.0% | 20.5% |
| Mean | 94.9% | 91.9% |
| Median | 95.0% | 92.4% |
| Interquartile 25% (IQ1) | 93.3% | 90.2% |
| Interquartile 75% (IQ3) | 96.2% | 94.1% |
| Interquartile Range (IQR) | 2.9% | 3.9% |
| Standard Deviation (Sample) | 3.2% | 3.4% |
| Standard Deviation (Population) | 3.2% | 3.4% |
Similar Demographics by 8th Grade
Demographics Similar to Immigrants from Africa by 8th Grade
In terms of 8th grade, the demographic groups most similar to Immigrants from Africa are Senegalese (95.2%, a difference of 0.0%), Immigrants from Asia (95.2%, a difference of 0.020%), Costa Rican (95.2%, a difference of 0.020%), Nigerian (95.2%, a difference of 0.020%), and Native/Alaskan (95.2%, a difference of 0.030%).
| Demographics | Rating | Rank | 8th Grade |
| Immigrants | Panama | 4.1 /100 | #230 | Tragic 95.2% |
| Asians | 3.5 /100 | #231 | Tragic 95.2% |
| Indians (Asian) | 3.3 /100 | #232 | Tragic 95.2% |
| Immigrants | Asia | 3.1 /100 | #233 | Tragic 95.2% |
| Costa Ricans | 3.0 /100 | #234 | Tragic 95.2% |
| Nigerians | 2.9 /100 | #235 | Tragic 95.2% |
| Senegalese | 2.7 /100 | #236 | Tragic 95.2% |
| Immigrants | Africa | 2.7 /100 | #237 | Tragic 95.2% |
| Natives/Alaskans | 2.3 /100 | #238 | Tragic 95.2% |
| Immigrants | Sierra Leone | 2.1 /100 | #239 | Tragic 95.1% |
| Ethiopians | 2.0 /100 | #240 | Tragic 95.1% |
| South American Indians | 1.9 /100 | #241 | Tragic 95.1% |
| Tongans | 1.7 /100 | #242 | Tragic 95.1% |
| Paiute | 1.7 /100 | #243 | Tragic 95.1% |
| Immigrants | Middle Africa | 1.7 /100 | #244 | Tragic 95.1% |
Demographics Similar to Ecuadorians by 8th Grade
In terms of 8th grade, the demographic groups most similar to Ecuadorians are Immigrants (93.6%, a difference of 0.020%), Japanese (93.6%, a difference of 0.030%), Immigrants from Bangladesh (93.6%, a difference of 0.030%), Cape Verdean (93.5%, a difference of 0.070%), and Immigrants from Caribbean (93.5%, a difference of 0.10%).
| Demographics | Rating | Rank | 8th Grade |
| Immigrants | Laos | 0.0 /100 | #301 | Tragic 94.1% |
| Sri Lankans | 0.0 /100 | #302 | Tragic 94.0% |
| Immigrants | Dominica | 0.0 /100 | #303 | Tragic 94.0% |
| Guyanese | 0.0 /100 | #304 | Tragic 93.9% |
| Immigrants | Haiti | 0.0 /100 | #305 | Tragic 93.9% |
| Immigrants | Guyana | 0.0 /100 | #306 | Tragic 93.8% |
| Immigrants | Portugal | 0.0 /100 | #307 | Tragic 93.8% |
| Ecuadorians | 0.0 /100 | #308 | Tragic 93.6% |
| Immigrants | Immigrants | 0.0 /100 | #309 | Tragic 93.6% |
| Japanese | 0.0 /100 | #310 | Tragic 93.6% |
| Immigrants | Bangladesh | 0.0 /100 | #311 | Tragic 93.6% |
| Cape Verdeans | 0.0 /100 | #312 | Tragic 93.5% |
| Immigrants | Caribbean | 0.0 /100 | #313 | Tragic 93.5% |
| Immigrants | Vietnam | 0.0 /100 | #314 | Tragic 93.5% |
| Vietnamese | 0.0 /100 | #315 | Tragic 93.5% |