Icelander vs Chinese Unemployment Among Ages 25 to 29 years
COMPARE
Icelander
Chinese
Unemployment Among Ages 25 to 29 years
Unemployment Among Ages 25 to 29 years Comparison
Icelanders
Chinese
6.3%
UNEMPLOYMENT AMONG AGES 25 TO 29 YEARS
96.6/ 100
METRIC RATING
77th/ 347
METRIC RANK
6.1%
UNEMPLOYMENT AMONG AGES 25 TO 29 YEARS
99.6/ 100
METRIC RATING
32nd/ 347
METRIC RANK
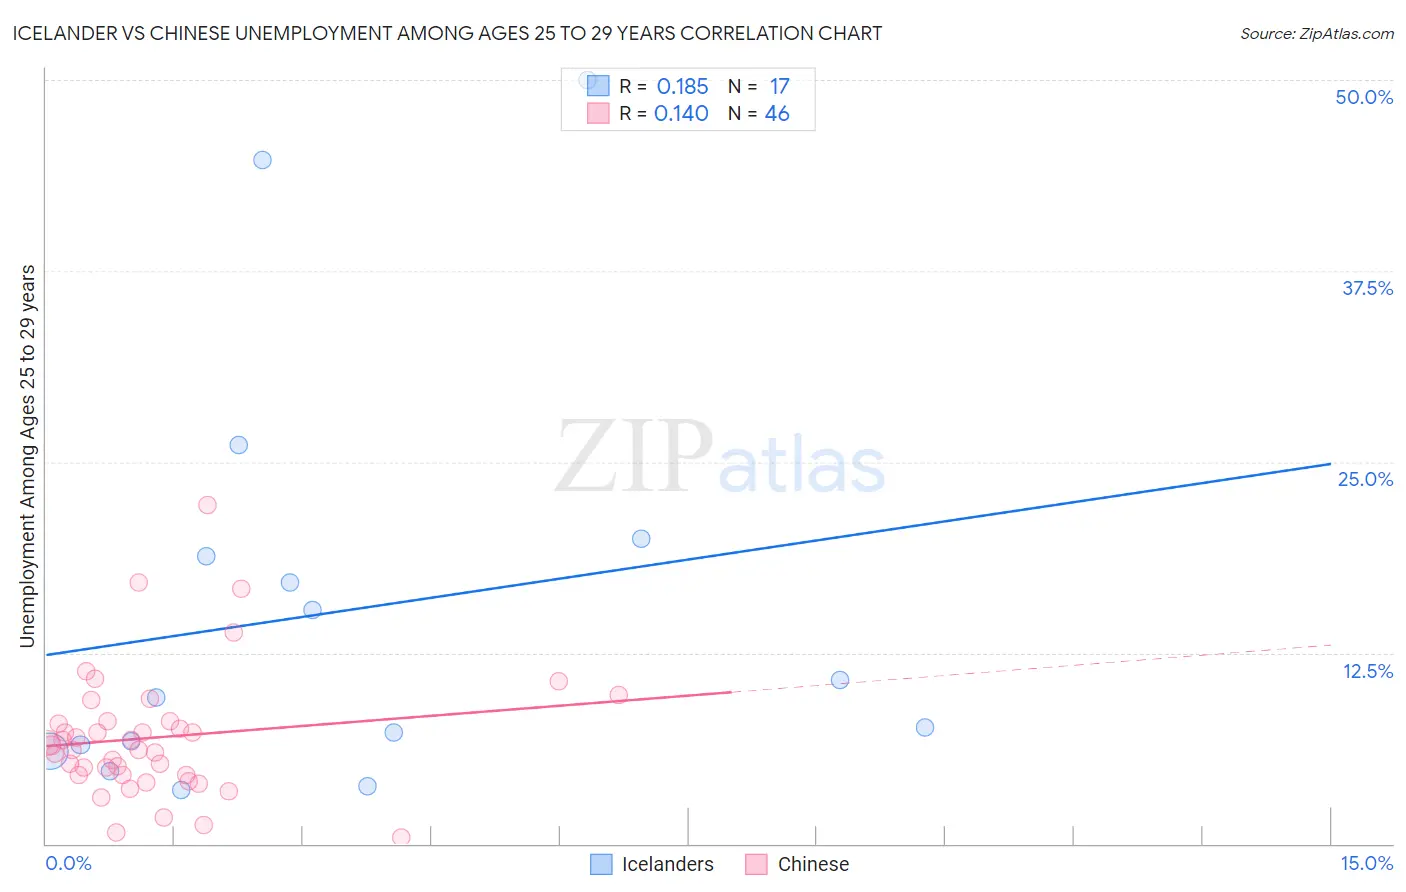
Icelander vs Chinese Unemployment Among Ages 25 to 29 years Correlation Chart
The statistical analysis conducted on geographies consisting of 154,630,748 people shows a poor positive correlation between the proportion of Icelanders and unemployment rate among population between the ages 25 and 29 in the United States with a correlation coefficient (R) of 0.185 and weighted average of 6.3%. Similarly, the statistical analysis conducted on geographies consisting of 63,787,303 people shows a poor positive correlation between the proportion of Chinese and unemployment rate among population between the ages 25 and 29 in the United States with a correlation coefficient (R) of 0.140 and weighted average of 6.1%, a difference of 3.6%.
Unemployment Among Ages 25 to 29 years Correlation Summary
| Measurement | Icelander | Chinese |
| Minimum | 3.5% | 0.40% |
| Maximum | 50.0% | 22.2% |
| Range | 46.5% | 21.8% |
| Mean | 15.2% | 7.0% |
| Median | 9.6% | 6.3% |
| Interquartile 25% (IQ1) | 6.3% | 4.5% |
| Interquartile 75% (IQ3) | 19.4% | 8.0% |
| Interquartile Range (IQR) | 13.1% | 3.5% |
| Standard Deviation (Sample) | 13.7% | 4.2% |
| Standard Deviation (Population) | 13.3% | 4.2% |
Similar Demographics by Unemployment Among Ages 25 to 29 years
Demographics Similar to Icelanders by Unemployment Among Ages 25 to 29 years
In terms of unemployment among ages 25 to 29 years, the demographic groups most similar to Icelanders are Immigrants from Korea (6.3%, a difference of 0.020%), Immigrants from Jordan (6.3%, a difference of 0.080%), Asian (6.3%, a difference of 0.10%), Carpatho Rusyn (6.3%, a difference of 0.16%), and Belgian (6.3%, a difference of 0.18%).
| Demographics | Rating | Rank | Unemployment Among Ages 25 to 29 years |
| Immigrants | Malaysia | 97.5 /100 | #70 | Exceptional 6.3% |
| Immigrants | France | 97.4 /100 | #71 | Exceptional 6.3% |
| Scandinavians | 97.4 /100 | #72 | Exceptional 6.3% |
| Belgians | 97.0 /100 | #73 | Exceptional 6.3% |
| Carpatho Rusyns | 96.9 /100 | #74 | Exceptional 6.3% |
| Immigrants | Jordan | 96.8 /100 | #75 | Exceptional 6.3% |
| Immigrants | Korea | 96.7 /100 | #76 | Exceptional 6.3% |
| Icelanders | 96.6 /100 | #77 | Exceptional 6.3% |
| Asians | 96.4 /100 | #78 | Exceptional 6.3% |
| Immigrants | Switzerland | 96.0 /100 | #79 | Exceptional 6.3% |
| Immigrants | Romania | 95.9 /100 | #80 | Exceptional 6.3% |
| Iranians | 95.8 /100 | #81 | Exceptional 6.3% |
| Immigrants | Poland | 95.7 /100 | #82 | Exceptional 6.3% |
| Slovenes | 95.3 /100 | #83 | Exceptional 6.3% |
| Immigrants | Spain | 95.2 /100 | #84 | Exceptional 6.3% |
Demographics Similar to Chinese by Unemployment Among Ages 25 to 29 years
In terms of unemployment among ages 25 to 29 years, the demographic groups most similar to Chinese are Yugoslavian (6.1%, a difference of 0.10%), Filipino (6.1%, a difference of 0.35%), Immigrants from Morocco (6.1%, a difference of 0.36%), Immigrants from Zimbabwe (6.1%, a difference of 0.40%), and Taiwanese (6.1%, a difference of 0.42%).
| Demographics | Rating | Rank | Unemployment Among Ages 25 to 29 years |
| New Zealanders | 99.8 /100 | #25 | Exceptional 6.0% |
| Immigrants | Eastern Africa | 99.8 /100 | #26 | Exceptional 6.0% |
| Immigrants | Zaire | 99.7 /100 | #27 | Exceptional 6.0% |
| Danes | 99.7 /100 | #28 | Exceptional 6.0% |
| Immigrants | South Central Asia | 99.7 /100 | #29 | Exceptional 6.1% |
| Bulgarians | 99.7 /100 | #30 | Exceptional 6.1% |
| Filipinos | 99.7 /100 | #31 | Exceptional 6.1% |
| Chinese | 99.6 /100 | #32 | Exceptional 6.1% |
| Yugoslavians | 99.6 /100 | #33 | Exceptional 6.1% |
| Immigrants | Morocco | 99.5 /100 | #34 | Exceptional 6.1% |
| Immigrants | Zimbabwe | 99.5 /100 | #35 | Exceptional 6.1% |
| Taiwanese | 99.5 /100 | #36 | Exceptional 6.1% |
| Immigrants | Serbia | 99.5 /100 | #37 | Exceptional 6.1% |
| Ethiopians | 99.4 /100 | #38 | Exceptional 6.1% |
| Indonesians | 99.3 /100 | #39 | Exceptional 6.1% |