Fijian vs Chinese Median Male Earnings
COMPARE
Fijian
Chinese
Median Male Earnings
Median Male Earnings Comparison
Fijians
Chinese
$45,607
MEDIAN MALE EARNINGS
0.0/ 100
METRIC RATING
321st/ 347
METRIC RANK
$56,872
MEDIAN MALE EARNINGS
91.1/ 100
METRIC RATING
126th/ 347
METRIC RANK
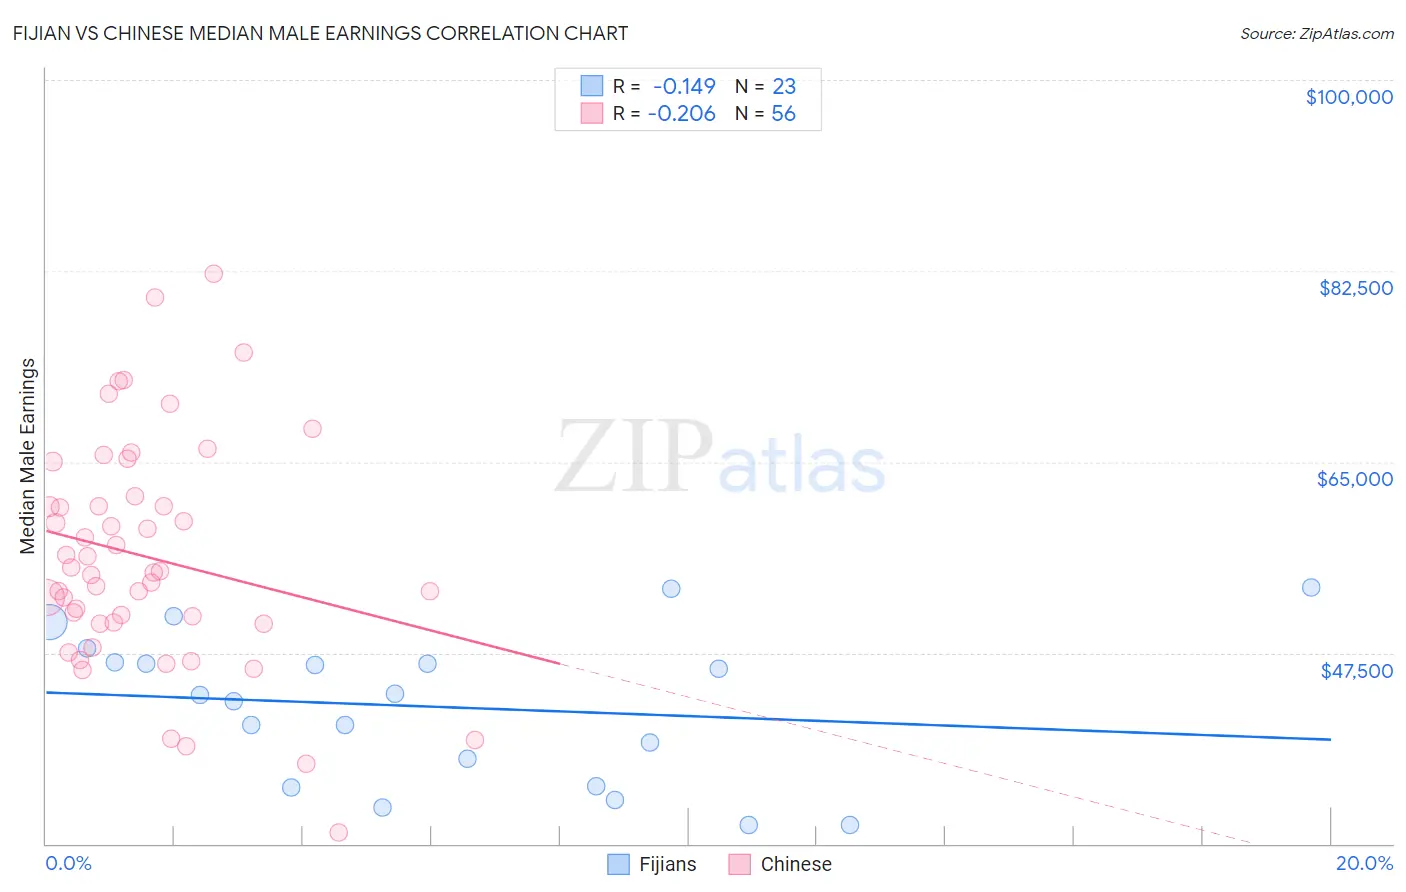
Fijian vs Chinese Median Male Earnings Correlation Chart
The statistical analysis conducted on geographies consisting of 55,945,280 people shows a poor negative correlation between the proportion of Fijians and median male earnings in the United States with a correlation coefficient (R) of -0.149 and weighted average of $45,607. Similarly, the statistical analysis conducted on geographies consisting of 64,807,348 people shows a weak negative correlation between the proportion of Chinese and median male earnings in the United States with a correlation coefficient (R) of -0.206 and weighted average of $56,872, a difference of 24.7%.
Median Male Earnings Correlation Summary
| Measurement | Fijian | Chinese |
| Minimum | $31,736 | $31,000 |
| Maximum | $53,542 | $82,197 |
| Range | $21,806 | $51,197 |
| Mean | $42,546 | $56,277 |
| Median | $43,625 | $54,905 |
| Interquartile 25% (IQ1) | $35,286 | $50,221 |
| Interquartile 75% (IQ3) | $46,656 | $61,384 |
| Interquartile Range (IQR) | $11,370 | $11,163 |
| Standard Deviation (Sample) | $6,788 | $10,489 |
| Standard Deviation (Population) | $6,639 | $10,395 |
Similar Demographics by Median Male Earnings
Demographics Similar to Fijians by Median Male Earnings
In terms of median male earnings, the demographic groups most similar to Fijians are Sioux ($45,566, a difference of 0.090%), Immigrants from Central America ($45,538, a difference of 0.15%), Black/African American ($45,523, a difference of 0.18%), Yuman ($45,446, a difference of 0.35%), and Immigrants from Honduras ($45,787, a difference of 0.39%).
| Demographics | Rating | Rank | Median Male Earnings |
| Chippewa | 0.0 /100 | #314 | Tragic $46,368 |
| Immigrants | Guatemala | 0.0 /100 | #315 | Tragic $46,244 |
| Immigrants | Caribbean | 0.0 /100 | #316 | Tragic $46,193 |
| Mexicans | 0.0 /100 | #317 | Tragic $46,147 |
| Cheyenne | 0.0 /100 | #318 | Tragic $46,062 |
| Haitians | 0.0 /100 | #319 | Tragic $45,903 |
| Immigrants | Honduras | 0.0 /100 | #320 | Tragic $45,787 |
| Fijians | 0.0 /100 | #321 | Tragic $45,607 |
| Sioux | 0.0 /100 | #322 | Tragic $45,566 |
| Immigrants | Central America | 0.0 /100 | #323 | Tragic $45,538 |
| Blacks/African Americans | 0.0 /100 | #324 | Tragic $45,523 |
| Yuman | 0.0 /100 | #325 | Tragic $45,446 |
| Immigrants | Haiti | 0.0 /100 | #326 | Tragic $45,266 |
| Immigrants | Bahamas | 0.0 /100 | #327 | Tragic $45,176 |
| Kiowa | 0.0 /100 | #328 | Tragic $45,094 |
Demographics Similar to Chinese by Median Male Earnings
In terms of median male earnings, the demographic groups most similar to Chinese are Brazilian ($56,837, a difference of 0.060%), Immigrants from Syria ($56,830, a difference of 0.070%), Immigrants from Morocco ($56,958, a difference of 0.15%), Chilean ($56,973, a difference of 0.18%), and Pakistani ($56,719, a difference of 0.27%).
| Demographics | Rating | Rank | Median Male Earnings |
| Arabs | 94.0 /100 | #119 | Exceptional $57,298 |
| Canadians | 93.9 /100 | #120 | Exceptional $57,286 |
| Immigrants | Albania | 93.3 /100 | #121 | Exceptional $57,179 |
| Immigrants | Jordan | 93.1 /100 | #122 | Exceptional $57,145 |
| Slovenes | 93.1 /100 | #123 | Exceptional $57,145 |
| Chileans | 91.9 /100 | #124 | Exceptional $56,973 |
| Immigrants | Morocco | 91.8 /100 | #125 | Exceptional $56,958 |
| Chinese | 91.1 /100 | #126 | Exceptional $56,872 |
| Brazilians | 90.9 /100 | #127 | Exceptional $56,837 |
| Immigrants | Syria | 90.8 /100 | #128 | Exceptional $56,830 |
| Pakistanis | 89.9 /100 | #129 | Excellent $56,719 |
| Koreans | 89.4 /100 | #130 | Excellent $56,672 |
| Portuguese | 89.4 /100 | #131 | Excellent $56,663 |
| Czechs | 88.2 /100 | #132 | Excellent $56,546 |
| Immigrants | Germany | 88.2 /100 | #133 | Excellent $56,542 |