Peruvian vs Immigrants from Russia Householder Income Ages 25 - 44 years
COMPARE
Peruvian
Immigrants from Russia
Householder Income Ages 25 - 44 years
Householder Income Ages 25 - 44 years Comparison
Peruvians
Immigrants from Russia
$98,886
HOUSEHOLDER INCOME AGES 25 - 44 YEARS
91.7/ 100
METRIC RATING
121st/ 347
METRIC RANK
$108,751
HOUSEHOLDER INCOME AGES 25 - 44 YEARS
100.0/ 100
METRIC RATING
37th/ 347
METRIC RANK
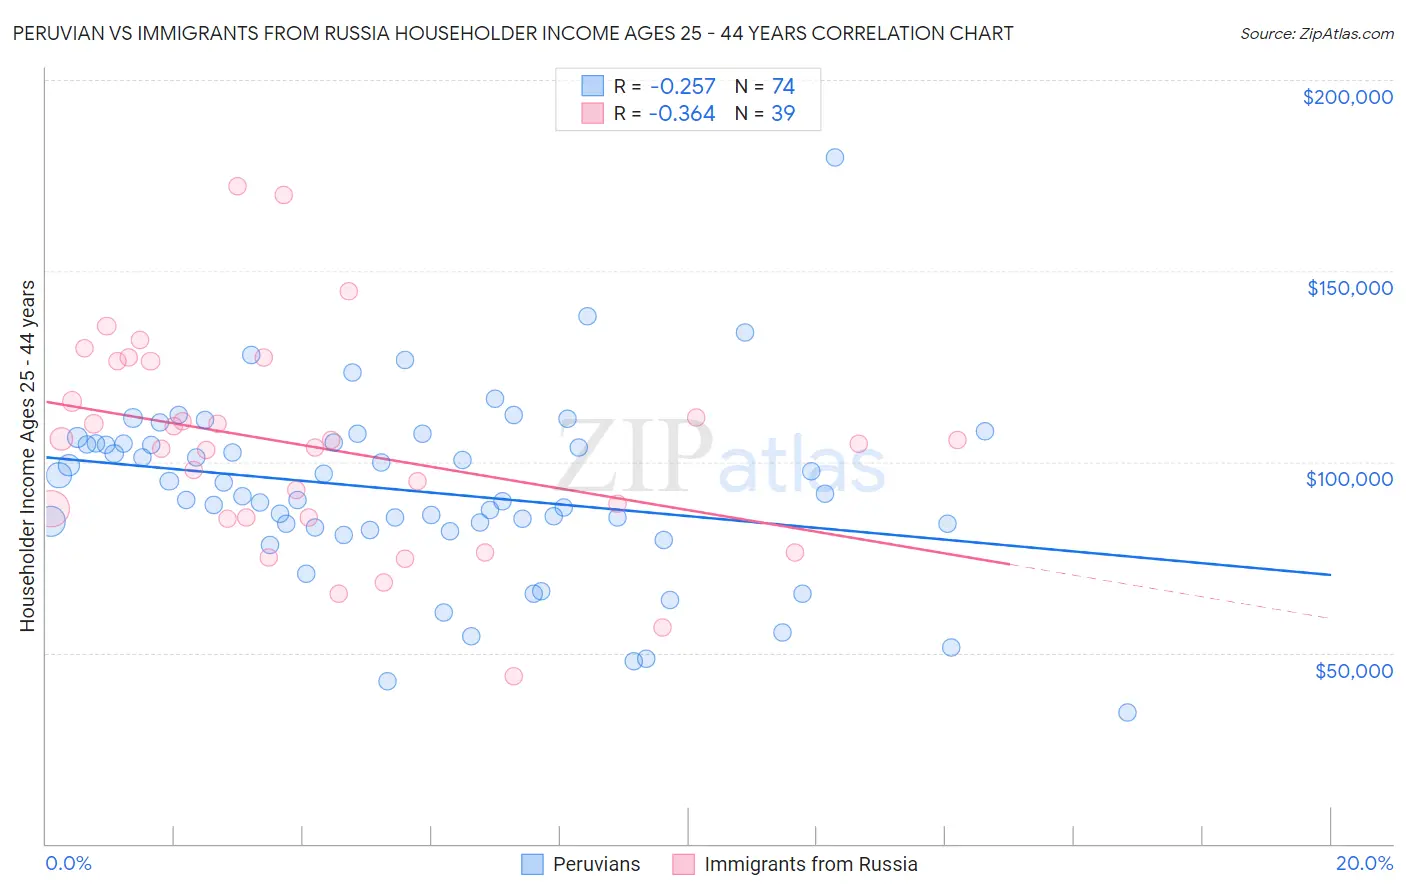
Peruvian vs Immigrants from Russia Householder Income Ages 25 - 44 years Correlation Chart
The statistical analysis conducted on geographies consisting of 362,388,350 people shows a weak negative correlation between the proportion of Peruvians and household income with householder between the ages 25 and 44 in the United States with a correlation coefficient (R) of -0.257 and weighted average of $98,886. Similarly, the statistical analysis conducted on geographies consisting of 347,220,944 people shows a mild negative correlation between the proportion of Immigrants from Russia and household income with householder between the ages 25 and 44 in the United States with a correlation coefficient (R) of -0.364 and weighted average of $108,751, a difference of 10.0%.
Householder Income Ages 25 - 44 years Correlation Summary
| Measurement | Peruvian | Immigrants from Russia |
| Minimum | $34,268 | $43,724 |
| Maximum | $179,830 | $172,064 |
| Range | $145,562 | $128,340 |
| Mean | $92,331 | $103,731 |
| Median | $91,247 | $104,773 |
| Interquartile 25% (IQ1) | $82,833 | $85,291 |
| Interquartile 75% (IQ3) | $104,839 | $126,225 |
| Interquartile Range (IQR) | $22,006 | $40,934 |
| Standard Deviation (Sample) | $23,482 | $27,697 |
| Standard Deviation (Population) | $23,323 | $27,339 |
Similar Demographics by Householder Income Ages 25 - 44 years
Demographics Similar to Peruvians by Householder Income Ages 25 - 44 years
In terms of householder income ages 25 - 44 years, the demographic groups most similar to Peruvians are Immigrants from Uzbekistan ($98,849, a difference of 0.040%), Palestinian ($98,777, a difference of 0.11%), Swedish ($99,136, a difference of 0.25%), Jordanian ($99,186, a difference of 0.30%), and Zimbabwean ($98,586, a difference of 0.30%).
| Demographics | Rating | Rank | Householder Income Ages 25 - 44 years |
| Immigrants | Western Asia | 94.0 /100 | #114 | Exceptional $99,516 |
| Carpatho Rusyns | 93.7 /100 | #115 | Exceptional $99,449 |
| Portuguese | 93.7 /100 | #116 | Exceptional $99,429 |
| Immigrants | Northern Africa | 93.0 /100 | #117 | Exceptional $99,232 |
| Syrians | 92.9 /100 | #118 | Exceptional $99,215 |
| Jordanians | 92.8 /100 | #119 | Exceptional $99,186 |
| Swedes | 92.7 /100 | #120 | Exceptional $99,136 |
| Peruvians | 91.7 /100 | #121 | Exceptional $98,886 |
| Immigrants | Uzbekistan | 91.5 /100 | #122 | Exceptional $98,849 |
| Palestinians | 91.2 /100 | #123 | Exceptional $98,777 |
| Zimbabweans | 90.3 /100 | #124 | Exceptional $98,586 |
| Pakistanis | 89.3 /100 | #125 | Excellent $98,401 |
| British | 89.1 /100 | #126 | Excellent $98,359 |
| Serbians | 88.9 /100 | #127 | Excellent $98,320 |
| Europeans | 88.9 /100 | #128 | Excellent $98,310 |
Demographics Similar to Immigrants from Russia by Householder Income Ages 25 - 44 years
In terms of householder income ages 25 - 44 years, the demographic groups most similar to Immigrants from Russia are Latvian ($108,926, a difference of 0.16%), Soviet Union ($108,457, a difference of 0.27%), Immigrants from Switzerland ($109,185, a difference of 0.40%), Immigrants from France ($108,257, a difference of 0.46%), and Immigrants from Lithuania ($108,149, a difference of 0.56%).
| Demographics | Rating | Rank | Householder Income Ages 25 - 44 years |
| Immigrants | Greece | 100.0 /100 | #30 | Exceptional $110,103 |
| Maltese | 100.0 /100 | #31 | Exceptional $110,064 |
| Immigrants | Sri Lanka | 100.0 /100 | #32 | Exceptional $109,741 |
| Bhutanese | 100.0 /100 | #33 | Exceptional $109,520 |
| Bolivians | 100.0 /100 | #34 | Exceptional $109,372 |
| Immigrants | Switzerland | 100.0 /100 | #35 | Exceptional $109,185 |
| Latvians | 100.0 /100 | #36 | Exceptional $108,926 |
| Immigrants | Russia | 100.0 /100 | #37 | Exceptional $108,751 |
| Soviet Union | 100.0 /100 | #38 | Exceptional $108,457 |
| Immigrants | France | 99.9 /100 | #39 | Exceptional $108,257 |
| Immigrants | Lithuania | 99.9 /100 | #40 | Exceptional $108,149 |
| Immigrants | Bolivia | 99.9 /100 | #41 | Exceptional $108,128 |
| Australians | 99.9 /100 | #42 | Exceptional $107,912 |
| Immigrants | Malaysia | 99.9 /100 | #43 | Exceptional $107,650 |
| Immigrants | Indonesia | 99.9 /100 | #44 | Exceptional $107,627 |