Czechoslovakian vs Guyanese Householder Income Ages 25 - 44 years
COMPARE
Czechoslovakian
Guyanese
Householder Income Ages 25 - 44 years
Householder Income Ages 25 - 44 years Comparison
Czechoslovakians
Guyanese
$95,070
HOUSEHOLDER INCOME AGES 25 - 44 YEARS
57.0/ 100
METRIC RATING
167th/ 347
METRIC RANK
$89,940
HOUSEHOLDER INCOME AGES 25 - 44 YEARS
7.1/ 100
METRIC RATING
218th/ 347
METRIC RANK
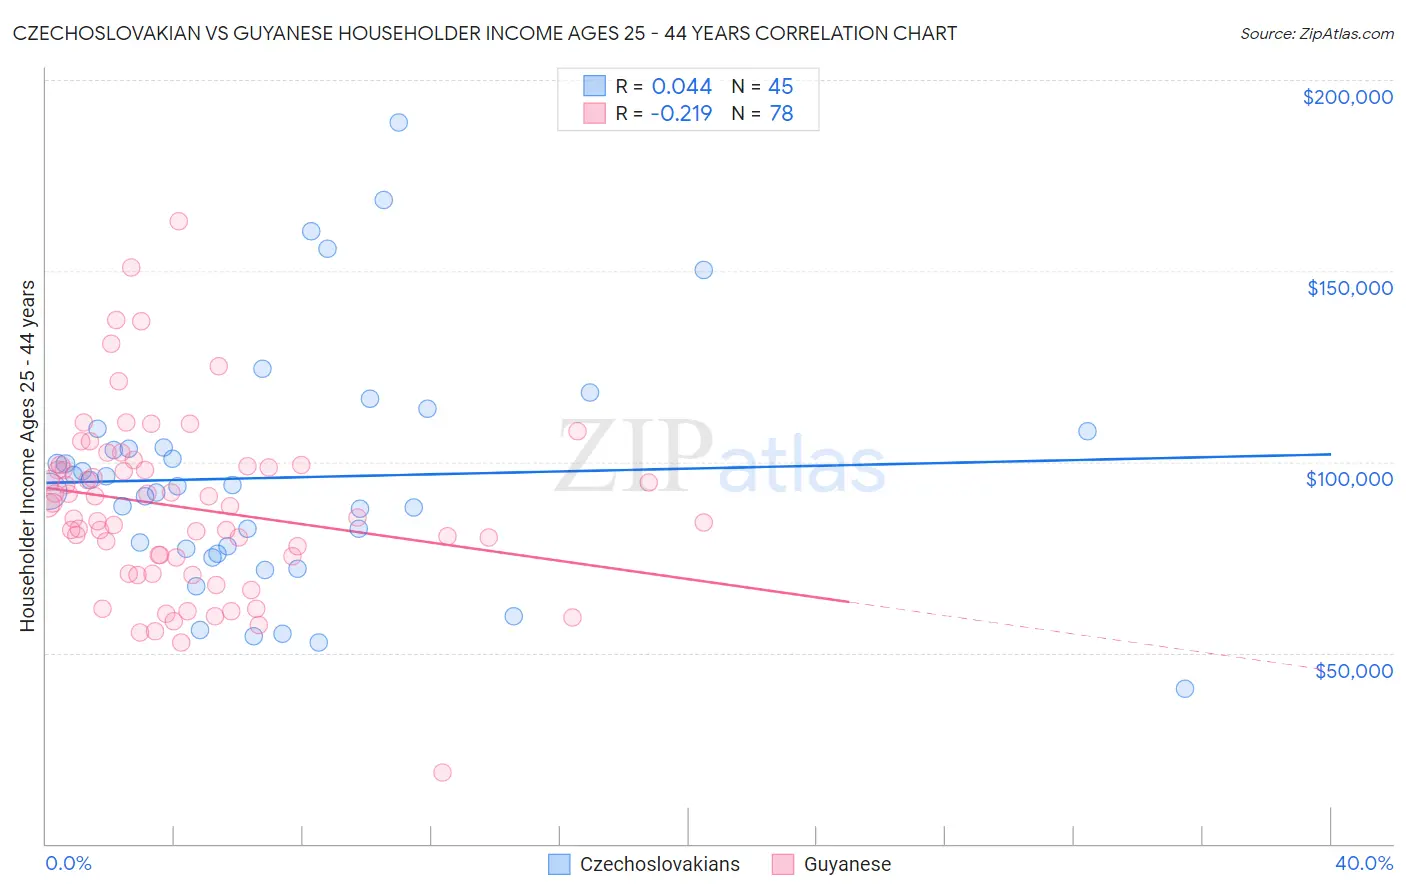
Czechoslovakian vs Guyanese Householder Income Ages 25 - 44 years Correlation Chart
The statistical analysis conducted on geographies consisting of 367,645,828 people shows no correlation between the proportion of Czechoslovakians and household income with householder between the ages 25 and 44 in the United States with a correlation coefficient (R) of 0.044 and weighted average of $95,070. Similarly, the statistical analysis conducted on geographies consisting of 176,637,436 people shows a weak negative correlation between the proportion of Guyanese and household income with householder between the ages 25 and 44 in the United States with a correlation coefficient (R) of -0.219 and weighted average of $89,940, a difference of 5.7%.
Householder Income Ages 25 - 44 years Correlation Summary
| Measurement | Czechoslovakian | Guyanese |
| Minimum | $40,625 | $18,657 |
| Maximum | $188,750 | $163,166 |
| Range | $148,125 | $144,509 |
| Mean | $95,911 | $87,951 |
| Median | $93,719 | $86,958 |
| Interquartile 25% (IQ1) | $76,645 | $75,027 |
| Interquartile 75% (IQ3) | $105,829 | $98,879 |
| Interquartile Range (IQR) | $29,184 | $23,852 |
| Standard Deviation (Sample) | $31,170 | $23,398 |
| Standard Deviation (Population) | $30,822 | $23,248 |
Similar Demographics by Householder Income Ages 25 - 44 years
Demographics Similar to Czechoslovakians by Householder Income Ages 25 - 44 years
In terms of householder income ages 25 - 44 years, the demographic groups most similar to Czechoslovakians are Alsatian ($95,059, a difference of 0.010%), Native Hawaiian ($95,058, a difference of 0.010%), Slovak ($95,032, a difference of 0.040%), Immigrants from Ethiopia ($95,256, a difference of 0.20%), and Immigrants from Armenia ($94,867, a difference of 0.21%).
| Demographics | Rating | Rank | Householder Income Ages 25 - 44 years |
| Icelanders | 63.4 /100 | #160 | Good $95,560 |
| Immigrants | Portugal | 62.8 /100 | #161 | Good $95,512 |
| Swiss | 62.8 /100 | #162 | Good $95,511 |
| Immigrants | Saudi Arabia | 62.0 /100 | #163 | Good $95,450 |
| South Americans | 60.9 /100 | #164 | Good $95,362 |
| Immigrants | Nepal | 60.3 /100 | #165 | Good $95,322 |
| Immigrants | Ethiopia | 59.5 /100 | #166 | Average $95,256 |
| Czechoslovakians | 57.0 /100 | #167 | Average $95,070 |
| Alsatians | 56.8 /100 | #168 | Average $95,059 |
| Native Hawaiians | 56.8 /100 | #169 | Average $95,058 |
| Slovaks | 56.4 /100 | #170 | Average $95,032 |
| Immigrants | Armenia | 54.2 /100 | #171 | Average $94,867 |
| Scottish | 50.8 /100 | #172 | Average $94,622 |
| Finns | 50.6 /100 | #173 | Average $94,610 |
| Colombians | 50.0 /100 | #174 | Average $94,565 |
Demographics Similar to Guyanese by Householder Income Ages 25 - 44 years
In terms of householder income ages 25 - 44 years, the demographic groups most similar to Guyanese are Scotch-Irish ($89,969, a difference of 0.030%), Delaware ($89,876, a difference of 0.070%), Trinidadian and Tobagonian ($89,856, a difference of 0.090%), Immigrants from Trinidad and Tobago ($89,748, a difference of 0.21%), and Ghanaian ($90,137, a difference of 0.22%).
| Demographics | Rating | Rank | Householder Income Ages 25 - 44 years |
| Iraqis | 10.8 /100 | #211 | Poor $90,764 |
| Hawaiians | 10.6 /100 | #212 | Poor $90,722 |
| Immigrants | Bangladesh | 9.3 /100 | #213 | Tragic $90,448 |
| Immigrants | Africa | 8.9 /100 | #214 | Tragic $90,372 |
| Panamanians | 8.1 /100 | #215 | Tragic $90,193 |
| Ghanaians | 7.9 /100 | #216 | Tragic $90,137 |
| Scotch-Irish | 7.3 /100 | #217 | Tragic $89,969 |
| Guyanese | 7.1 /100 | #218 | Tragic $89,940 |
| Delaware | 6.9 /100 | #219 | Tragic $89,876 |
| Trinidadians and Tobagonians | 6.8 /100 | #220 | Tragic $89,856 |
| Immigrants | Trinidad and Tobago | 6.5 /100 | #221 | Tragic $89,748 |
| Immigrants | Ecuador | 6.2 /100 | #222 | Tragic $89,673 |
| Immigrants | Guyana | 5.9 /100 | #223 | Tragic $89,586 |
| Barbadians | 5.9 /100 | #224 | Tragic $89,565 |
| Immigrants | Panama | 5.5 /100 | #225 | Tragic $89,451 |