Czechoslovakian vs African Per Capita Income
COMPARE
Czechoslovakian
African
Per Capita Income
Per Capita Income Comparison
Czechoslovakians
Africans
$43,806
PER CAPITA INCOME
54.1/ 100
METRIC RATING
172nd/ 347
METRIC RANK
$37,785
PER CAPITA INCOME
0.1/ 100
METRIC RATING
284th/ 347
METRIC RANK
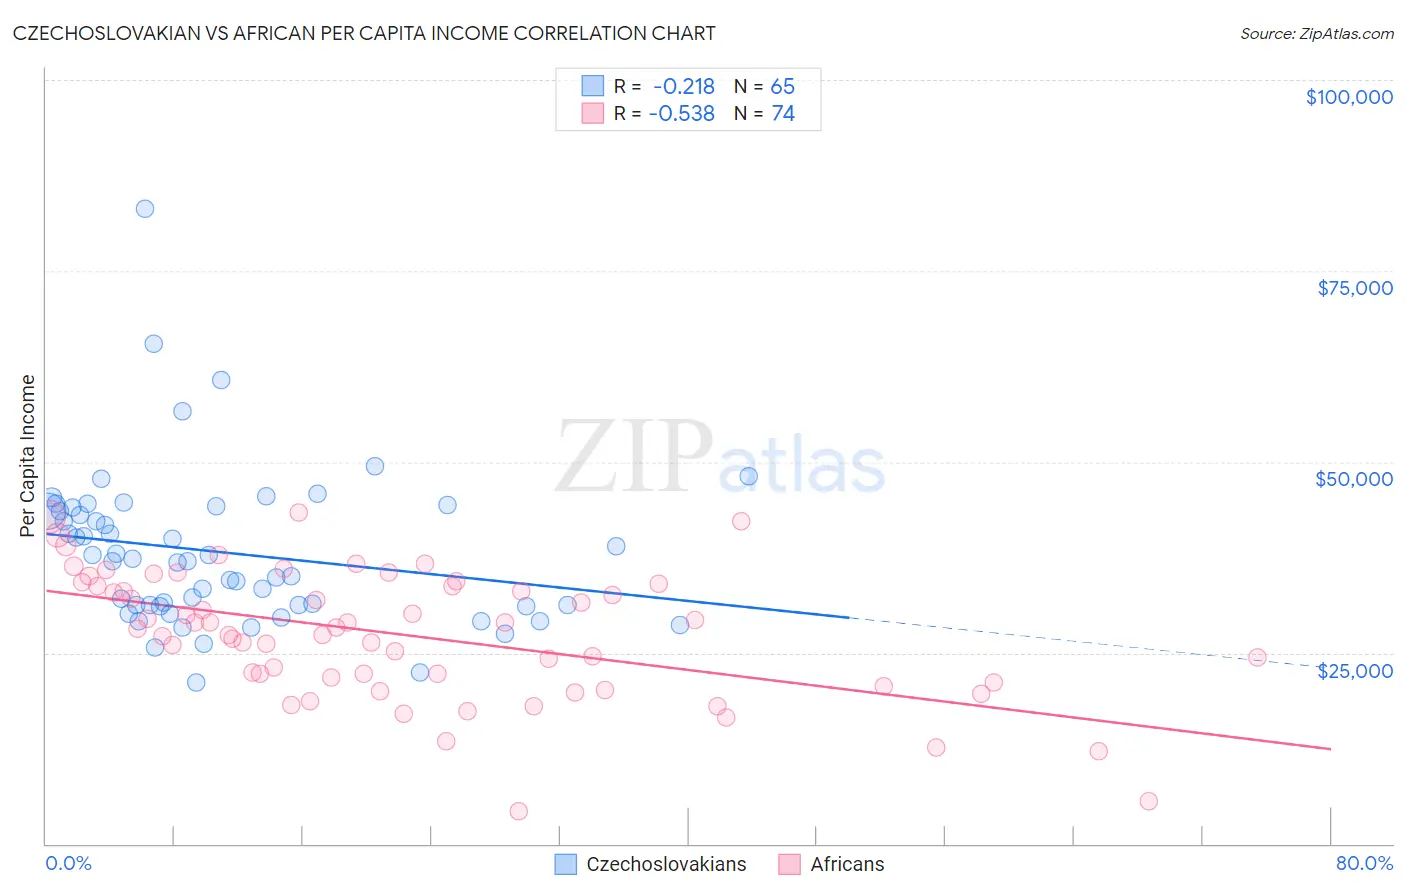
Czechoslovakian vs African Per Capita Income Correlation Chart
The statistical analysis conducted on geographies consisting of 368,679,879 people shows a weak negative correlation between the proportion of Czechoslovakians and per capita income in the United States with a correlation coefficient (R) of -0.218 and weighted average of $43,806. Similarly, the statistical analysis conducted on geographies consisting of 470,145,104 people shows a substantial negative correlation between the proportion of Africans and per capita income in the United States with a correlation coefficient (R) of -0.538 and weighted average of $37,785, a difference of 15.9%.
Per Capita Income Correlation Summary
| Measurement | Czechoslovakian | African |
| Minimum | $21,167 | $4,302 |
| Maximum | $83,138 | $43,354 |
| Range | $61,971 | $39,052 |
| Mean | $38,118 | $27,384 |
| Median | $36,952 | $28,229 |
| Interquartile 25% (IQ1) | $31,180 | $21,779 |
| Interquartile 75% (IQ3) | $43,747 | $33,791 |
| Interquartile Range (IQR) | $12,567 | $12,012 |
| Standard Deviation (Sample) | $10,239 | $8,322 |
| Standard Deviation (Population) | $10,160 | $8,265 |
Similar Demographics by Per Capita Income
Demographics Similar to Czechoslovakians by Per Capita Income
In terms of per capita income, the demographic groups most similar to Czechoslovakians are Immigrants from Eastern Africa ($43,838, a difference of 0.070%), Scandinavian ($43,848, a difference of 0.090%), Immigrants from Peru ($43,852, a difference of 0.11%), French ($43,685, a difference of 0.28%), and Belgian ($43,951, a difference of 0.33%).
| Demographics | Rating | Rank | Per Capita Income |
| Immigrants | Philippines | 59.4 /100 | #165 | Average $44,000 |
| Immigrants | Uruguay | 59.3 /100 | #166 | Average $43,997 |
| English | 58.9 /100 | #167 | Average $43,982 |
| Belgians | 58.1 /100 | #168 | Average $43,951 |
| Immigrants | Peru | 55.3 /100 | #169 | Average $43,852 |
| Scandinavians | 55.2 /100 | #170 | Average $43,848 |
| Immigrants | Eastern Africa | 54.9 /100 | #171 | Average $43,838 |
| Czechoslovakians | 54.1 /100 | #172 | Average $43,806 |
| French | 50.7 /100 | #173 | Average $43,685 |
| Colombians | 50.0 /100 | #174 | Average $43,661 |
| Celtics | 48.9 /100 | #175 | Average $43,621 |
| Immigrants | South Eastern Asia | 46.6 /100 | #176 | Average $43,539 |
| Tlingit-Haida | 45.9 /100 | #177 | Average $43,516 |
| Immigrants | Costa Rica | 44.5 /100 | #178 | Average $43,464 |
| Finns | 44.4 /100 | #179 | Average $43,461 |
Demographics Similar to Africans by Per Capita Income
In terms of per capita income, the demographic groups most similar to Africans are Guatemalan ($37,766, a difference of 0.050%), Pennsylvania German ($37,842, a difference of 0.15%), Immigrants from Laos ($37,857, a difference of 0.19%), Central American Indian ($37,699, a difference of 0.23%), and Dominican ($37,697, a difference of 0.24%).
| Demographics | Rating | Rank | Per Capita Income |
| Comanche | 0.2 /100 | #277 | Tragic $38,088 |
| Immigrants | Nicaragua | 0.2 /100 | #278 | Tragic $38,065 |
| Colville | 0.2 /100 | #279 | Tragic $38,047 |
| Potawatomi | 0.2 /100 | #280 | Tragic $38,046 |
| Immigrants | Dominica | 0.2 /100 | #281 | Tragic $37,952 |
| Immigrants | Laos | 0.1 /100 | #282 | Tragic $37,857 |
| Pennsylvania Germans | 0.1 /100 | #283 | Tragic $37,842 |
| Africans | 0.1 /100 | #284 | Tragic $37,785 |
| Guatemalans | 0.1 /100 | #285 | Tragic $37,766 |
| Central American Indians | 0.1 /100 | #286 | Tragic $37,699 |
| Dominicans | 0.1 /100 | #287 | Tragic $37,697 |
| Blackfeet | 0.1 /100 | #288 | Tragic $37,695 |
| U.S. Virgin Islanders | 0.1 /100 | #289 | Tragic $37,589 |
| Immigrants | Guatemala | 0.1 /100 | #290 | Tragic $37,550 |
| Cajuns | 0.1 /100 | #291 | Tragic $37,527 |