Hmong vs West Indian 4th Grade
COMPARE
Hmong
West Indian
4th Grade
4th Grade Comparison
Hmong
West Indians
97.7%
4TH GRADE
88.2/ 100
METRIC RATING
133rd/ 347
METRIC RANK
97.0%
4TH GRADE
0.4/ 100
METRIC RATING
262nd/ 347
METRIC RANK
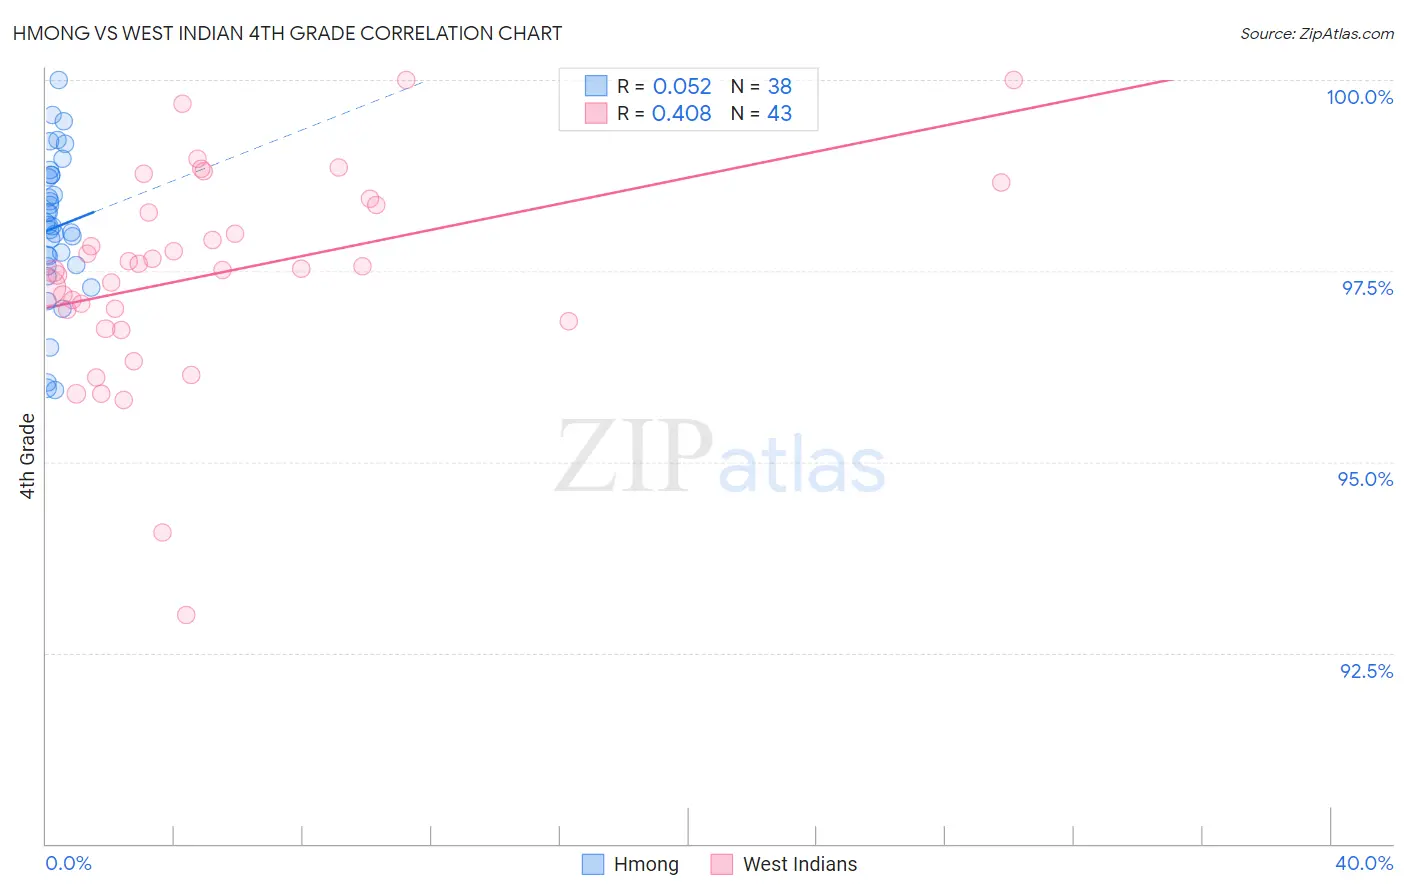
Hmong vs West Indian 4th Grade Correlation Chart
The statistical analysis conducted on geographies consisting of 24,672,093 people shows a slight positive correlation between the proportion of Hmong and percentage of population with at least 4th grade education in the United States with a correlation coefficient (R) of 0.052 and weighted average of 97.7%. Similarly, the statistical analysis conducted on geographies consisting of 254,059,006 people shows a moderate positive correlation between the proportion of West Indians and percentage of population with at least 4th grade education in the United States with a correlation coefficient (R) of 0.408 and weighted average of 97.0%, a difference of 0.73%.
4th Grade Correlation Summary
| Measurement | Hmong | West Indian |
| Minimum | 95.9% | 93.0% |
| Maximum | 100.0% | 100.0% |
| Range | 4.1% | 7.0% |
| Mean | 98.1% | 97.5% |
| Median | 98.1% | 97.5% |
| Interquartile 25% (IQ1) | 97.6% | 96.8% |
| Interquartile 75% (IQ3) | 98.8% | 98.4% |
| Interquartile Range (IQR) | 1.2% | 1.5% |
| Standard Deviation (Sample) | 0.97% | 1.4% |
| Standard Deviation (Population) | 0.95% | 1.4% |
Similar Demographics by 4th Grade
Demographics Similar to Hmong by 4th Grade
In terms of 4th grade, the demographic groups most similar to Hmong are Palestinian (97.7%, a difference of 0.0%), Cambodian (97.7%, a difference of 0.0%), Immigrants from Kuwait (97.7%, a difference of 0.010%), Immigrants from Hungary (97.7%, a difference of 0.010%), and Immigrants from Romania (97.7%, a difference of 0.020%).
| Demographics | Rating | Rank | 4th Grade |
| Immigrants | Europe | 92.5 /100 | #126 | Exceptional 97.8% |
| Colville | 92.3 /100 | #127 | Exceptional 97.7% |
| Pima | 92.0 /100 | #128 | Exceptional 97.7% |
| Immigrants | Bulgaria | 91.3 /100 | #129 | Exceptional 97.7% |
| Immigrants | Romania | 90.6 /100 | #130 | Exceptional 97.7% |
| Immigrants | Kuwait | 89.7 /100 | #131 | Excellent 97.7% |
| Immigrants | Hungary | 89.3 /100 | #132 | Excellent 97.7% |
| Hmong | 88.2 /100 | #133 | Excellent 97.7% |
| Palestinians | 88.1 /100 | #134 | Excellent 97.7% |
| Cambodians | 87.8 /100 | #135 | Excellent 97.7% |
| Israelis | 86.2 /100 | #136 | Excellent 97.7% |
| Immigrants | Turkey | 86.0 /100 | #137 | Excellent 97.7% |
| Blackfeet | 86.0 /100 | #138 | Excellent 97.7% |
| Seminole | 84.7 /100 | #139 | Excellent 97.7% |
| Filipinos | 84.0 /100 | #140 | Excellent 97.7% |
Demographics Similar to West Indians by 4th Grade
In terms of 4th grade, the demographic groups most similar to West Indians are Immigrants from Jamaica (97.0%, a difference of 0.0%), Immigrants from Sierra Leone (97.0%, a difference of 0.010%), Immigrants from South America (97.0%, a difference of 0.010%), Taiwanese (97.0%, a difference of 0.010%), and Immigrants from Ethiopia (97.0%, a difference of 0.020%).
| Demographics | Rating | Rank | 4th Grade |
| Peruvians | 0.7 /100 | #255 | Tragic 97.1% |
| Bolivians | 0.7 /100 | #256 | Tragic 97.1% |
| Immigrants | Congo | 0.5 /100 | #257 | Tragic 97.0% |
| Immigrants | Colombia | 0.5 /100 | #258 | Tragic 97.0% |
| Immigrants | Ethiopia | 0.4 /100 | #259 | Tragic 97.0% |
| Immigrants | Sierra Leone | 0.4 /100 | #260 | Tragic 97.0% |
| Immigrants | South America | 0.4 /100 | #261 | Tragic 97.0% |
| West Indians | 0.4 /100 | #262 | Tragic 97.0% |
| Immigrants | Jamaica | 0.3 /100 | #263 | Tragic 97.0% |
| Taiwanese | 0.3 /100 | #264 | Tragic 97.0% |
| Armenians | 0.3 /100 | #265 | Tragic 97.0% |
| Immigrants | China | 0.3 /100 | #266 | Tragic 97.0% |
| Immigrants | Nigeria | 0.3 /100 | #267 | Tragic 97.0% |
| Ghanaians | 0.2 /100 | #268 | Tragic 97.0% |
| Immigrants | Uzbekistan | 0.2 /100 | #269 | Tragic 96.9% |