Pima vs Immigrants from Bulgaria Householder Income Over 65 years
COMPARE
Pima
Immigrants from Bulgaria
Householder Income Over 65 years
Householder Income Over 65 years Comparison
Pima
Immigrants from Bulgaria
$50,539
HOUSEHOLDER INCOME OVER 65 YEARS
0.0/ 100
METRIC RATING
331st/ 347
METRIC RANK
$64,379
HOUSEHOLDER INCOME OVER 65 YEARS
97.3/ 100
METRIC RATING
92nd/ 347
METRIC RANK
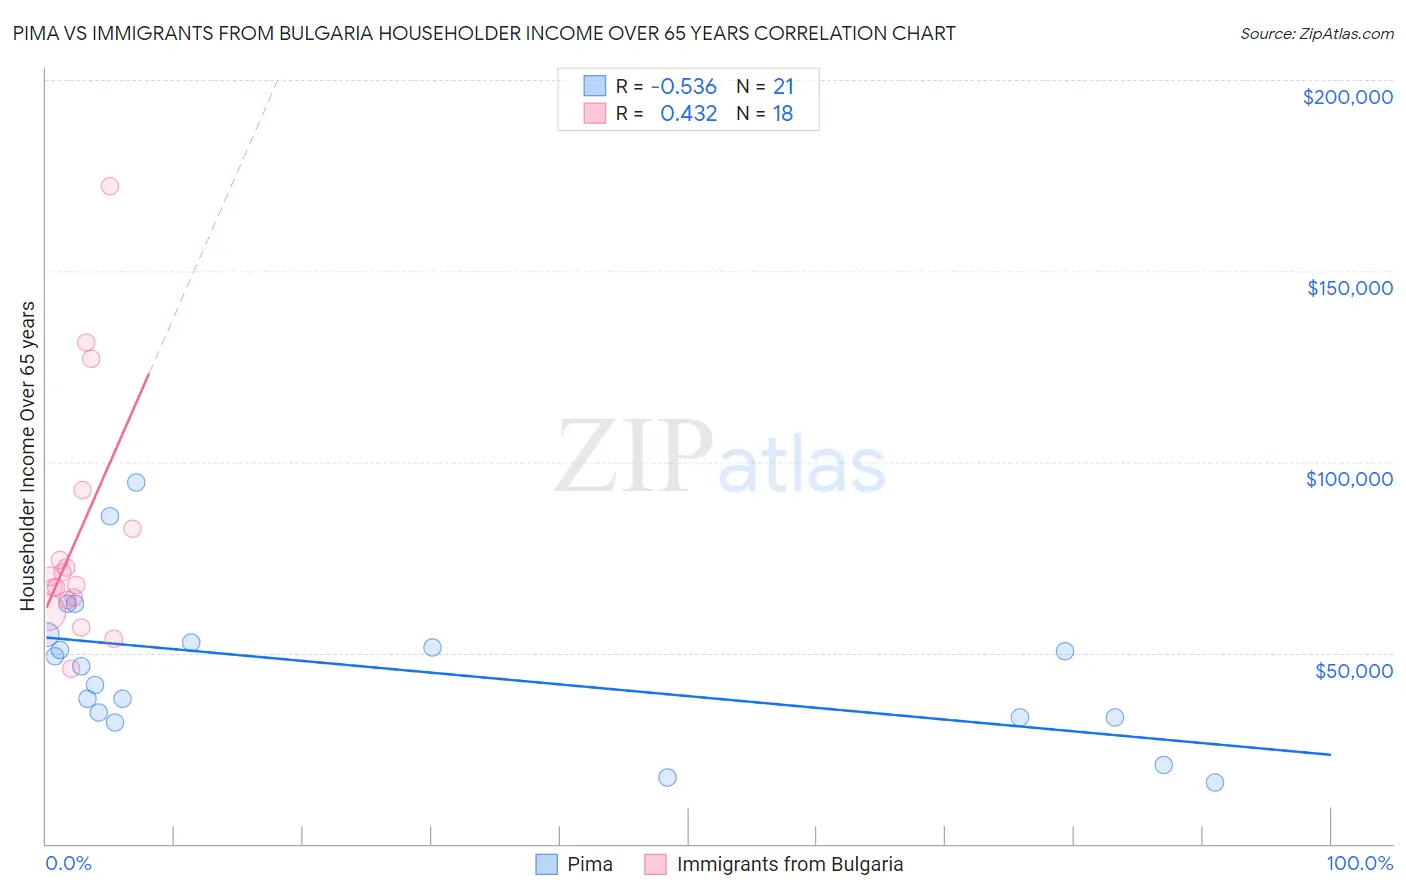
Pima vs Immigrants from Bulgaria Householder Income Over 65 years Correlation Chart
The statistical analysis conducted on geographies consisting of 61,493,441 people shows a substantial negative correlation between the proportion of Pima and household income with householder over the age of 65 in the United States with a correlation coefficient (R) of -0.536 and weighted average of $50,539. Similarly, the statistical analysis conducted on geographies consisting of 172,418,440 people shows a moderate positive correlation between the proportion of Immigrants from Bulgaria and household income with householder over the age of 65 in the United States with a correlation coefficient (R) of 0.432 and weighted average of $64,379, a difference of 27.4%.
Householder Income Over 65 years Correlation Summary
| Measurement | Pima | Immigrants from Bulgaria |
| Minimum | $15,972 | $45,828 |
| Maximum | $94,583 | $172,188 |
| Range | $78,611 | $126,360 |
| Mean | $45,976 | $80,014 |
| Median | $46,564 | $68,903 |
| Interquartile 25% (IQ1) | $33,050 | $63,986 |
| Interquartile 75% (IQ3) | $53,656 | $82,333 |
| Interquartile Range (IQR) | $20,606 | $18,347 |
| Standard Deviation (Sample) | $19,860 | $32,104 |
| Standard Deviation (Population) | $19,381 | $31,200 |
Similar Demographics by Householder Income Over 65 years
Demographics Similar to Pima by Householder Income Over 65 years
In terms of householder income over 65 years, the demographic groups most similar to Pima are Dutch West Indian ($50,475, a difference of 0.13%), Immigrants from Grenada ($50,747, a difference of 0.41%), Black/African American ($50,779, a difference of 0.47%), Hopi ($50,925, a difference of 0.76%), and Bahamian ($51,000, a difference of 0.91%).
| Demographics | Rating | Rank | Householder Income Over 65 years |
| Immigrants | Congo | 0.0 /100 | #324 | Tragic $51,393 |
| Immigrants | Haiti | 0.0 /100 | #325 | Tragic $51,219 |
| Kiowa | 0.0 /100 | #326 | Tragic $51,140 |
| Bahamians | 0.0 /100 | #327 | Tragic $51,000 |
| Hopi | 0.0 /100 | #328 | Tragic $50,925 |
| Blacks/African Americans | 0.0 /100 | #329 | Tragic $50,779 |
| Immigrants | Grenada | 0.0 /100 | #330 | Tragic $50,747 |
| Pima | 0.0 /100 | #331 | Tragic $50,539 |
| Dutch West Indians | 0.0 /100 | #332 | Tragic $50,475 |
| Cape Verdeans | 0.0 /100 | #333 | Tragic $50,077 |
| Immigrants | Dominica | 0.0 /100 | #334 | Tragic $50,071 |
| Crow | 0.0 /100 | #335 | Tragic $49,234 |
| Cubans | 0.0 /100 | #336 | Tragic $49,152 |
| Tohono O'odham | 0.0 /100 | #337 | Tragic $49,121 |
| Immigrants | Caribbean | 0.0 /100 | #338 | Tragic $48,535 |
Demographics Similar to Immigrants from Bulgaria by Householder Income Over 65 years
In terms of householder income over 65 years, the demographic groups most similar to Immigrants from Bulgaria are Immigrants from Oceania ($64,416, a difference of 0.060%), Immigrants from Kuwait ($64,433, a difference of 0.080%), Paraguayan ($64,443, a difference of 0.10%), Jordanian ($64,313, a difference of 0.10%), and Immigrants from Romania ($64,462, a difference of 0.13%).
| Demographics | Rating | Rank | Householder Income Over 65 years |
| Immigrants | Lebanon | 97.6 /100 | #85 | Exceptional $64,521 |
| Immigrants | Russia | 97.6 /100 | #86 | Exceptional $64,512 |
| Austrians | 97.5 /100 | #87 | Exceptional $64,470 |
| Immigrants | Romania | 97.5 /100 | #88 | Exceptional $64,462 |
| Paraguayans | 97.4 /100 | #89 | Exceptional $64,443 |
| Immigrants | Kuwait | 97.4 /100 | #90 | Exceptional $64,433 |
| Immigrants | Oceania | 97.4 /100 | #91 | Exceptional $64,416 |
| Immigrants | Bulgaria | 97.3 /100 | #92 | Exceptional $64,379 |
| Jordanians | 97.1 /100 | #93 | Exceptional $64,313 |
| Immigrants | Egypt | 97.0 /100 | #94 | Exceptional $64,299 |
| Immigrants | Latvia | 97.0 /100 | #95 | Exceptional $64,298 |
| Immigrants | Hungary | 97.0 /100 | #96 | Exceptional $64,277 |
| Sri Lankans | 96.7 /100 | #97 | Exceptional $64,201 |
| Romanians | 96.5 /100 | #98 | Exceptional $64,142 |
| Assyrians/Chaldeans/Syriacs | 96.4 /100 | #99 | Exceptional $64,108 |