Czechoslovakian vs Bahamian Per Capita Income
COMPARE
Czechoslovakian
Bahamian
Per Capita Income
Per Capita Income Comparison
Czechoslovakians
Bahamians
$43,806
PER CAPITA INCOME
54.1/ 100
METRIC RATING
172nd/ 347
METRIC RANK
$36,427
PER CAPITA INCOME
0.0/ 100
METRIC RATING
313th/ 347
METRIC RANK
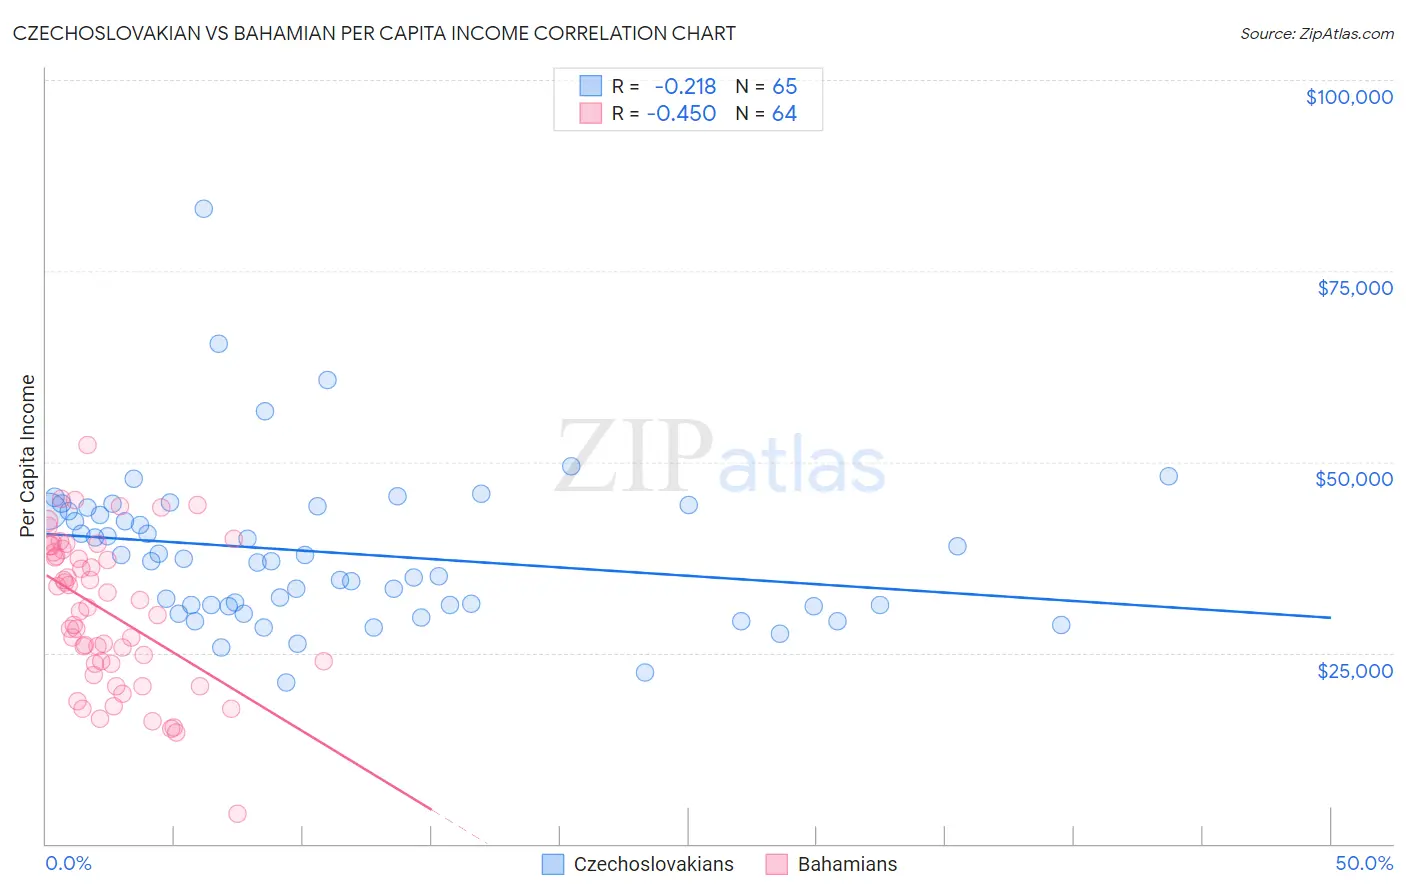
Czechoslovakian vs Bahamian Per Capita Income Correlation Chart
The statistical analysis conducted on geographies consisting of 368,679,879 people shows a weak negative correlation between the proportion of Czechoslovakians and per capita income in the United States with a correlation coefficient (R) of -0.218 and weighted average of $43,806. Similarly, the statistical analysis conducted on geographies consisting of 112,707,980 people shows a moderate negative correlation between the proportion of Bahamians and per capita income in the United States with a correlation coefficient (R) of -0.450 and weighted average of $36,427, a difference of 20.3%.
Per Capita Income Correlation Summary
| Measurement | Czechoslovakian | Bahamian |
| Minimum | $21,167 | $3,864 |
| Maximum | $83,138 | $52,210 |
| Range | $61,971 | $48,346 |
| Mean | $38,118 | $30,310 |
| Median | $36,952 | $30,639 |
| Interquartile 25% (IQ1) | $31,180 | $23,571 |
| Interquartile 75% (IQ3) | $43,747 | $38,367 |
| Interquartile Range (IQR) | $12,567 | $14,797 |
| Standard Deviation (Sample) | $10,239 | $9,801 |
| Standard Deviation (Population) | $10,160 | $9,724 |
Similar Demographics by Per Capita Income
Demographics Similar to Czechoslovakians by Per Capita Income
In terms of per capita income, the demographic groups most similar to Czechoslovakians are Immigrants from Eastern Africa ($43,838, a difference of 0.070%), Scandinavian ($43,848, a difference of 0.090%), Immigrants from Peru ($43,852, a difference of 0.11%), French ($43,685, a difference of 0.28%), and Belgian ($43,951, a difference of 0.33%).
| Demographics | Rating | Rank | Per Capita Income |
| Immigrants | Philippines | 59.4 /100 | #165 | Average $44,000 |
| Immigrants | Uruguay | 59.3 /100 | #166 | Average $43,997 |
| English | 58.9 /100 | #167 | Average $43,982 |
| Belgians | 58.1 /100 | #168 | Average $43,951 |
| Immigrants | Peru | 55.3 /100 | #169 | Average $43,852 |
| Scandinavians | 55.2 /100 | #170 | Average $43,848 |
| Immigrants | Eastern Africa | 54.9 /100 | #171 | Average $43,838 |
| Czechoslovakians | 54.1 /100 | #172 | Average $43,806 |
| French | 50.7 /100 | #173 | Average $43,685 |
| Colombians | 50.0 /100 | #174 | Average $43,661 |
| Celtics | 48.9 /100 | #175 | Average $43,621 |
| Immigrants | South Eastern Asia | 46.6 /100 | #176 | Average $43,539 |
| Tlingit-Haida | 45.9 /100 | #177 | Average $43,516 |
| Immigrants | Costa Rica | 44.5 /100 | #178 | Average $43,464 |
| Finns | 44.4 /100 | #179 | Average $43,461 |
Demographics Similar to Bahamians by Per Capita Income
In terms of per capita income, the demographic groups most similar to Bahamians are Chickasaw ($36,475, a difference of 0.13%), Chippewa ($36,631, a difference of 0.56%), Ute ($36,651, a difference of 0.62%), Immigrants from Honduras ($36,665, a difference of 0.65%), and Seminole ($36,180, a difference of 0.68%).
| Demographics | Rating | Rank | Per Capita Income |
| Immigrants | Haiti | 0.0 /100 | #306 | Tragic $36,849 |
| Immigrants | Latin America | 0.0 /100 | #307 | Tragic $36,823 |
| Fijians | 0.0 /100 | #308 | Tragic $36,690 |
| Immigrants | Honduras | 0.0 /100 | #309 | Tragic $36,665 |
| Ute | 0.0 /100 | #310 | Tragic $36,651 |
| Chippewa | 0.0 /100 | #311 | Tragic $36,631 |
| Chickasaw | 0.0 /100 | #312 | Tragic $36,475 |
| Bahamians | 0.0 /100 | #313 | Tragic $36,427 |
| Seminole | 0.0 /100 | #314 | Tragic $36,180 |
| Yaqui | 0.0 /100 | #315 | Tragic $36,112 |
| Choctaw | 0.0 /100 | #316 | Tragic $35,999 |
| Dutch West Indians | 0.0 /100 | #317 | Tragic $35,922 |
| Bangladeshis | 0.0 /100 | #318 | Tragic $35,897 |
| Immigrants | Congo | 0.0 /100 | #319 | Tragic $35,720 |
| Hispanics or Latinos | 0.0 /100 | #320 | Tragic $35,688 |