Immigrants from Croatia vs Immigrants from China Median Household Income
COMPARE
Immigrants from Croatia
Immigrants from China
Median Household Income
Median Household Income Comparison
Immigrants from Croatia
Immigrants from China
$92,225
MEDIAN HOUSEHOLD INCOME
99.0/ 100
METRIC RATING
85th/ 347
METRIC RANK
$105,335
MEDIAN HOUSEHOLD INCOME
100.0/ 100
METRIC RATING
11th/ 347
METRIC RANK
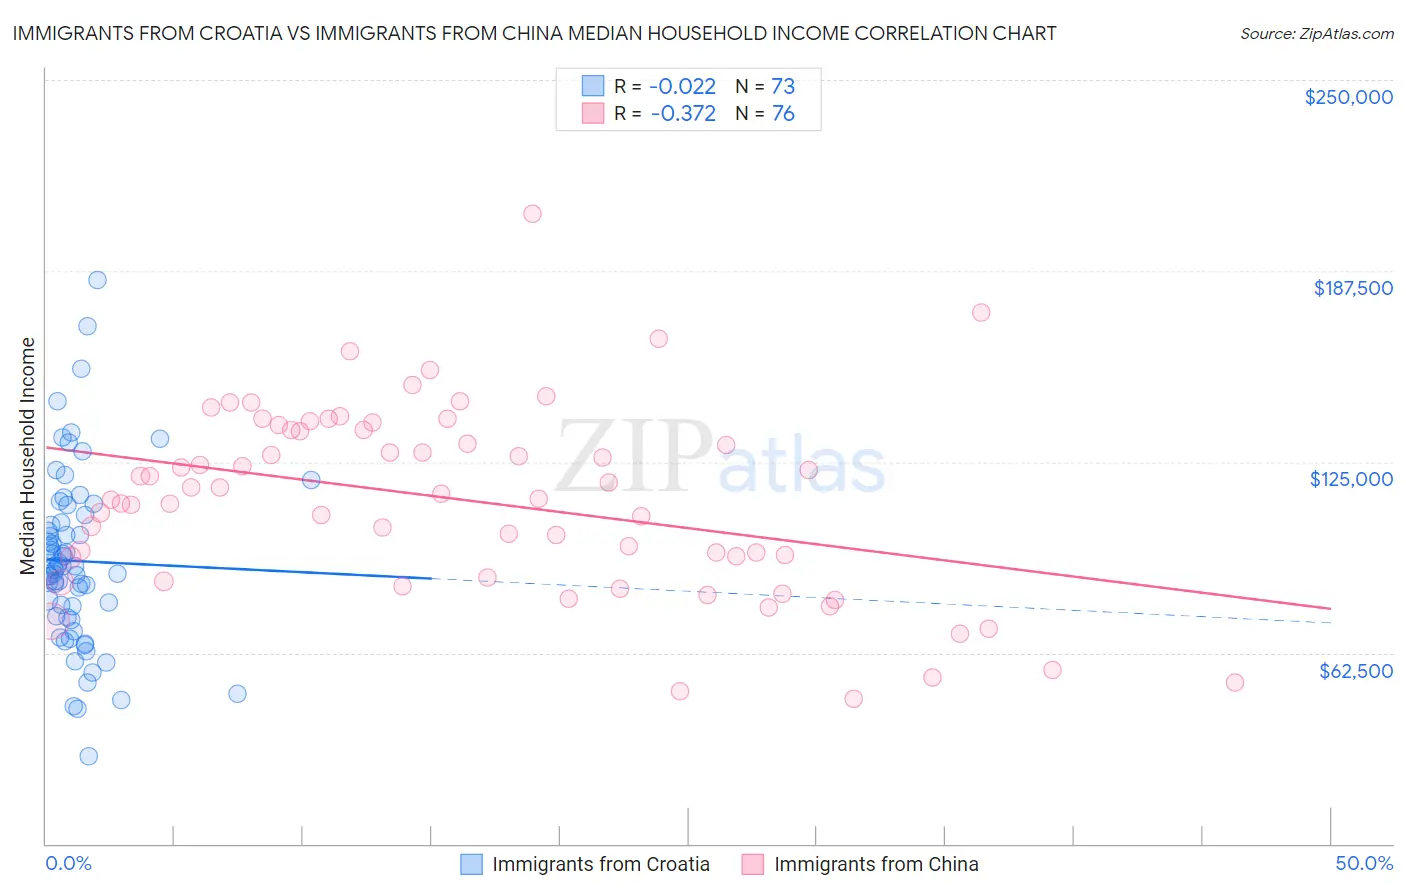
Immigrants from Croatia vs Immigrants from China Median Household Income Correlation Chart
The statistical analysis conducted on geographies consisting of 132,561,989 people shows no correlation between the proportion of Immigrants from Croatia and median household income in the United States with a correlation coefficient (R) of -0.022 and weighted average of $92,225. Similarly, the statistical analysis conducted on geographies consisting of 456,448,801 people shows a mild negative correlation between the proportion of Immigrants from China and median household income in the United States with a correlation coefficient (R) of -0.372 and weighted average of $105,335, a difference of 14.2%.
Median Household Income Correlation Summary
| Measurement | Immigrants from Croatia | Immigrants from China |
| Minimum | $28,542 | $47,386 |
| Maximum | $184,569 | $206,336 |
| Range | $156,027 | $158,950 |
| Mean | $92,543 | $112,457 |
| Median | $90,687 | $113,740 |
| Interquartile 25% (IQ1) | $74,217 | $90,379 |
| Interquartile 75% (IQ3) | $106,459 | $135,564 |
| Interquartile Range (IQR) | $32,243 | $45,185 |
| Standard Deviation (Sample) | $28,654 | $30,829 |
| Standard Deviation (Population) | $28,457 | $30,625 |
Similar Demographics by Median Household Income
Demographics Similar to Immigrants from Croatia by Median Household Income
In terms of median household income, the demographic groups most similar to Immigrants from Croatia are Immigrants from England ($92,098, a difference of 0.14%), Immigrants from Hungary ($92,094, a difference of 0.14%), Immigrants from Argentina ($92,417, a difference of 0.21%), Immigrants from Canada ($92,029, a difference of 0.21%), and Romanian ($91,994, a difference of 0.25%).
| Demographics | Rating | Rank | Median Household Income |
| Immigrants | Bulgaria | 99.4 /100 | #78 | Exceptional $93,148 |
| Sri Lankans | 99.4 /100 | #79 | Exceptional $93,093 |
| Tongans | 99.4 /100 | #80 | Exceptional $93,076 |
| Immigrants | Eastern Europe | 99.4 /100 | #81 | Exceptional $93,051 |
| Immigrants | Spain | 99.3 /100 | #82 | Exceptional $92,732 |
| Italians | 99.1 /100 | #83 | Exceptional $92,475 |
| Immigrants | Argentina | 99.1 /100 | #84 | Exceptional $92,417 |
| Immigrants | Croatia | 99.0 /100 | #85 | Exceptional $92,225 |
| Immigrants | England | 98.9 /100 | #86 | Exceptional $92,098 |
| Immigrants | Hungary | 98.9 /100 | #87 | Exceptional $92,094 |
| Immigrants | Canada | 98.8 /100 | #88 | Exceptional $92,029 |
| Romanians | 98.8 /100 | #89 | Exceptional $91,994 |
| Assyrians/Chaldeans/Syriacs | 98.8 /100 | #90 | Exceptional $91,991 |
| Immigrants | Vietnam | 98.8 /100 | #91 | Exceptional $91,987 |
| Immigrants | Western Europe | 98.8 /100 | #92 | Exceptional $91,936 |
Demographics Similar to Immigrants from China by Median Household Income
In terms of median household income, the demographic groups most similar to Immigrants from China are Indian (Asian) ($105,262, a difference of 0.070%), Immigrants from Eastern Asia ($104,796, a difference of 0.51%), Immigrants from Ireland ($104,692, a difference of 0.61%), Immigrants from South Central Asia ($106,057, a difference of 0.69%), and Immigrants from Israel ($104,090, a difference of 1.2%).
| Demographics | Rating | Rank | Median Household Income |
| Immigrants | Hong Kong | 100.0 /100 | #4 | Exceptional $111,519 |
| Thais | 100.0 /100 | #5 | Exceptional $110,648 |
| Immigrants | Singapore | 100.0 /100 | #6 | Exceptional $110,428 |
| Iranians | 100.0 /100 | #7 | Exceptional $109,835 |
| Immigrants | Iran | 100.0 /100 | #8 | Exceptional $108,055 |
| Okinawans | 100.0 /100 | #9 | Exceptional $106,624 |
| Immigrants | South Central Asia | 100.0 /100 | #10 | Exceptional $106,057 |
| Immigrants | China | 100.0 /100 | #11 | Exceptional $105,335 |
| Indians (Asian) | 100.0 /100 | #12 | Exceptional $105,262 |
| Immigrants | Eastern Asia | 100.0 /100 | #13 | Exceptional $104,796 |
| Immigrants | Ireland | 100.0 /100 | #14 | Exceptional $104,692 |
| Immigrants | Israel | 100.0 /100 | #15 | Exceptional $104,090 |
| Burmese | 100.0 /100 | #16 | Exceptional $103,145 |
| Immigrants | Korea | 100.0 /100 | #17 | Exceptional $102,962 |
| Cypriots | 100.0 /100 | #18 | Exceptional $102,843 |