Burmese vs Cuban Householder Income Under 25 years
COMPARE
Burmese
Cuban
Householder Income Under 25 years
Householder Income Under 25 years Comparison
Burmese
Cubans
$54,800
HOUSEHOLDER INCOME UNDER 25 YEARS
99.8/ 100
METRIC RATING
64th/ 347
METRIC RANK
$50,655
HOUSEHOLDER INCOME UNDER 25 YEARS
2.3/ 100
METRIC RATING
242nd/ 347
METRIC RANK
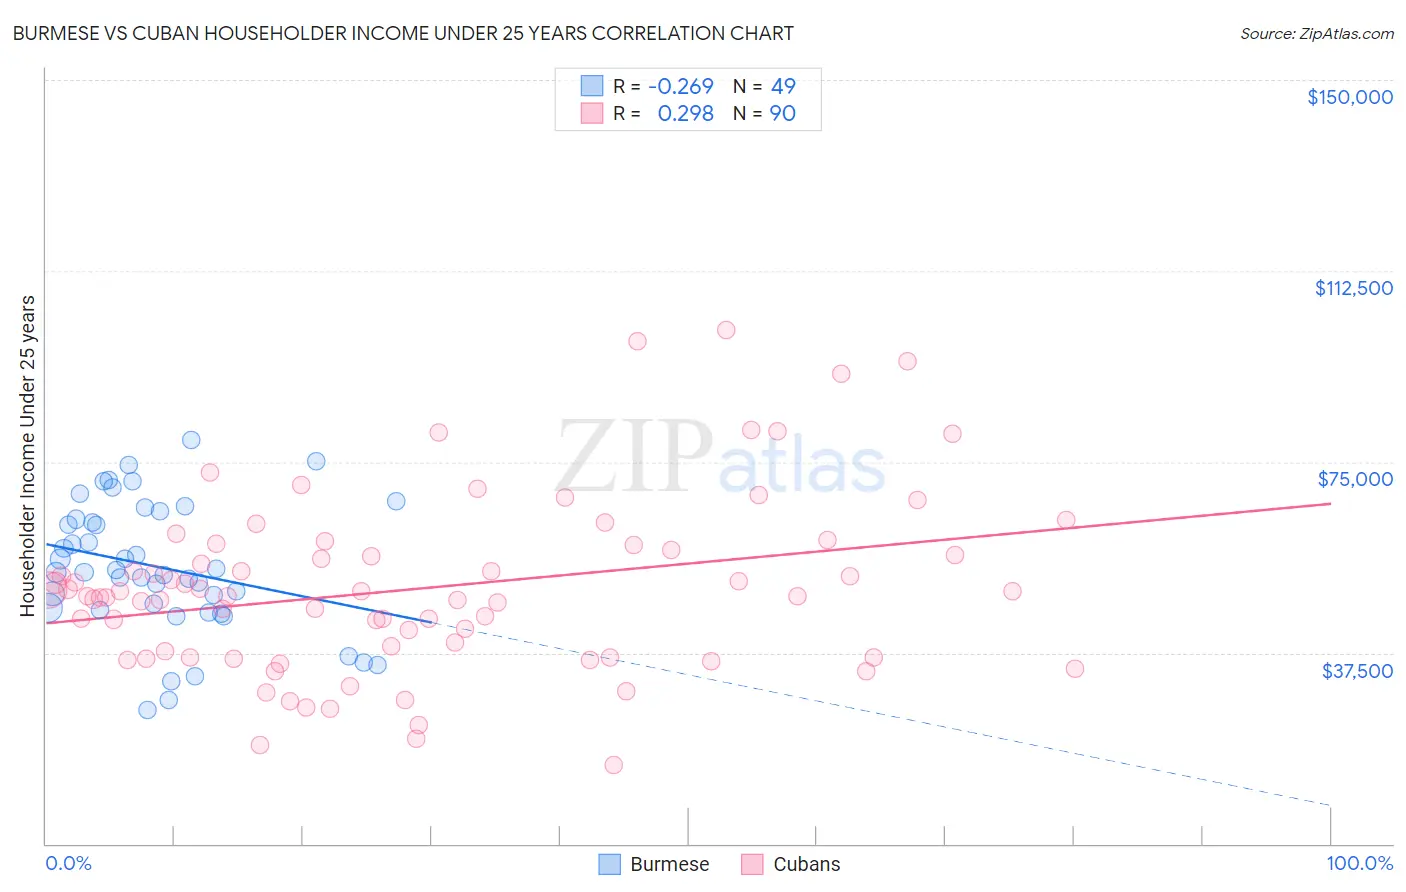
Burmese vs Cuban Householder Income Under 25 years Correlation Chart
The statistical analysis conducted on geographies consisting of 384,248,177 people shows a weak negative correlation between the proportion of Burmese and household income with householder under the age of 25 in the United States with a correlation coefficient (R) of -0.269 and weighted average of $54,800. Similarly, the statistical analysis conducted on geographies consisting of 372,353,328 people shows a weak positive correlation between the proportion of Cubans and household income with householder under the age of 25 in the United States with a correlation coefficient (R) of 0.298 and weighted average of $50,655, a difference of 8.2%.
Householder Income Under 25 years Correlation Summary
| Measurement | Burmese | Cuban |
| Minimum | $26,390 | $15,559 |
| Maximum | $79,180 | $100,948 |
| Range | $52,790 | $85,389 |
| Mean | $54,342 | $50,192 |
| Median | $53,322 | $48,589 |
| Interquartile 25% (IQ1) | $46,146 | $36,667 |
| Interquartile 75% (IQ3) | $64,573 | $57,791 |
| Interquartile Range (IQR) | $18,428 | $21,124 |
| Standard Deviation (Sample) | $12,749 | $17,185 |
| Standard Deviation (Population) | $12,618 | $17,090 |
Similar Demographics by Householder Income Under 25 years
Demographics Similar to Burmese by Householder Income Under 25 years
In terms of householder income under 25 years, the demographic groups most similar to Burmese are Immigrants from Belgium ($54,830, a difference of 0.060%), Immigrants from Uzbekistan ($54,846, a difference of 0.080%), Yup'ik ($54,732, a difference of 0.12%), Immigrants from Bangladesh ($54,714, a difference of 0.16%), and Okinawan ($54,701, a difference of 0.18%).
| Demographics | Rating | Rank | Householder Income Under 25 years |
| Soviet Union | 100.0 /100 | #57 | Exceptional $55,340 |
| Guyanese | 99.9 /100 | #58 | Exceptional $55,210 |
| Native Hawaiians | 99.9 /100 | #59 | Exceptional $55,158 |
| Immigrants | Lithuania | 99.9 /100 | #60 | Exceptional $55,028 |
| Immigrants | Europe | 99.9 /100 | #61 | Exceptional $55,022 |
| Immigrants | Uzbekistan | 99.8 /100 | #62 | Exceptional $54,846 |
| Immigrants | Belgium | 99.8 /100 | #63 | Exceptional $54,830 |
| Burmese | 99.8 /100 | #64 | Exceptional $54,800 |
| Yup'ik | 99.8 /100 | #65 | Exceptional $54,732 |
| Immigrants | Bangladesh | 99.8 /100 | #66 | Exceptional $54,714 |
| Okinawans | 99.8 /100 | #67 | Exceptional $54,701 |
| Tsimshian | 99.8 /100 | #68 | Exceptional $54,649 |
| Samoans | 99.7 /100 | #69 | Exceptional $54,610 |
| Immigrants | El Salvador | 99.7 /100 | #70 | Exceptional $54,599 |
| Immigrants | Morocco | 99.7 /100 | #71 | Exceptional $54,593 |
Demographics Similar to Cubans by Householder Income Under 25 years
In terms of householder income under 25 years, the demographic groups most similar to Cubans are Immigrants from Thailand ($50,645, a difference of 0.020%), Marshallese ($50,627, a difference of 0.060%), Immigrants from Micronesia ($50,691, a difference of 0.070%), Immigrants from Africa ($50,609, a difference of 0.090%), and Welsh ($50,597, a difference of 0.12%).
| Demographics | Rating | Rank | Householder Income Under 25 years |
| Spanish | 3.3 /100 | #235 | Tragic $50,813 |
| English | 3.3 /100 | #236 | Tragic $50,805 |
| Germans | 3.3 /100 | #237 | Tragic $50,804 |
| Iraqis | 3.2 /100 | #238 | Tragic $50,802 |
| Immigrants | Caribbean | 2.9 /100 | #239 | Tragic $50,757 |
| Immigrants | Lebanon | 2.7 /100 | #240 | Tragic $50,729 |
| Immigrants | Micronesia | 2.5 /100 | #241 | Tragic $50,691 |
| Cubans | 2.3 /100 | #242 | Tragic $50,655 |
| Immigrants | Thailand | 2.2 /100 | #243 | Tragic $50,645 |
| Marshallese | 2.1 /100 | #244 | Tragic $50,627 |
| Immigrants | Africa | 2.0 /100 | #245 | Tragic $50,609 |
| Welsh | 2.0 /100 | #246 | Tragic $50,597 |
| Immigrants | Bosnia and Herzegovina | 1.8 /100 | #247 | Tragic $50,565 |
| Slavs | 1.8 /100 | #248 | Tragic $50,563 |
| Scottish | 1.8 /100 | #249 | Tragic $50,554 |