Guyanese vs Immigrants from Nicaragua Householder Income Under 25 years
COMPARE
Guyanese
Immigrants from Nicaragua
Householder Income Under 25 years
Householder Income Under 25 years Comparison
Guyanese
Immigrants from Nicaragua
$55,210
HOUSEHOLDER INCOME UNDER 25 YEARS
99.9/ 100
METRIC RATING
58th/ 347
METRIC RANK
$53,266
HOUSEHOLDER INCOME UNDER 25 YEARS
93.3/ 100
METRIC RATING
131st/ 347
METRIC RANK
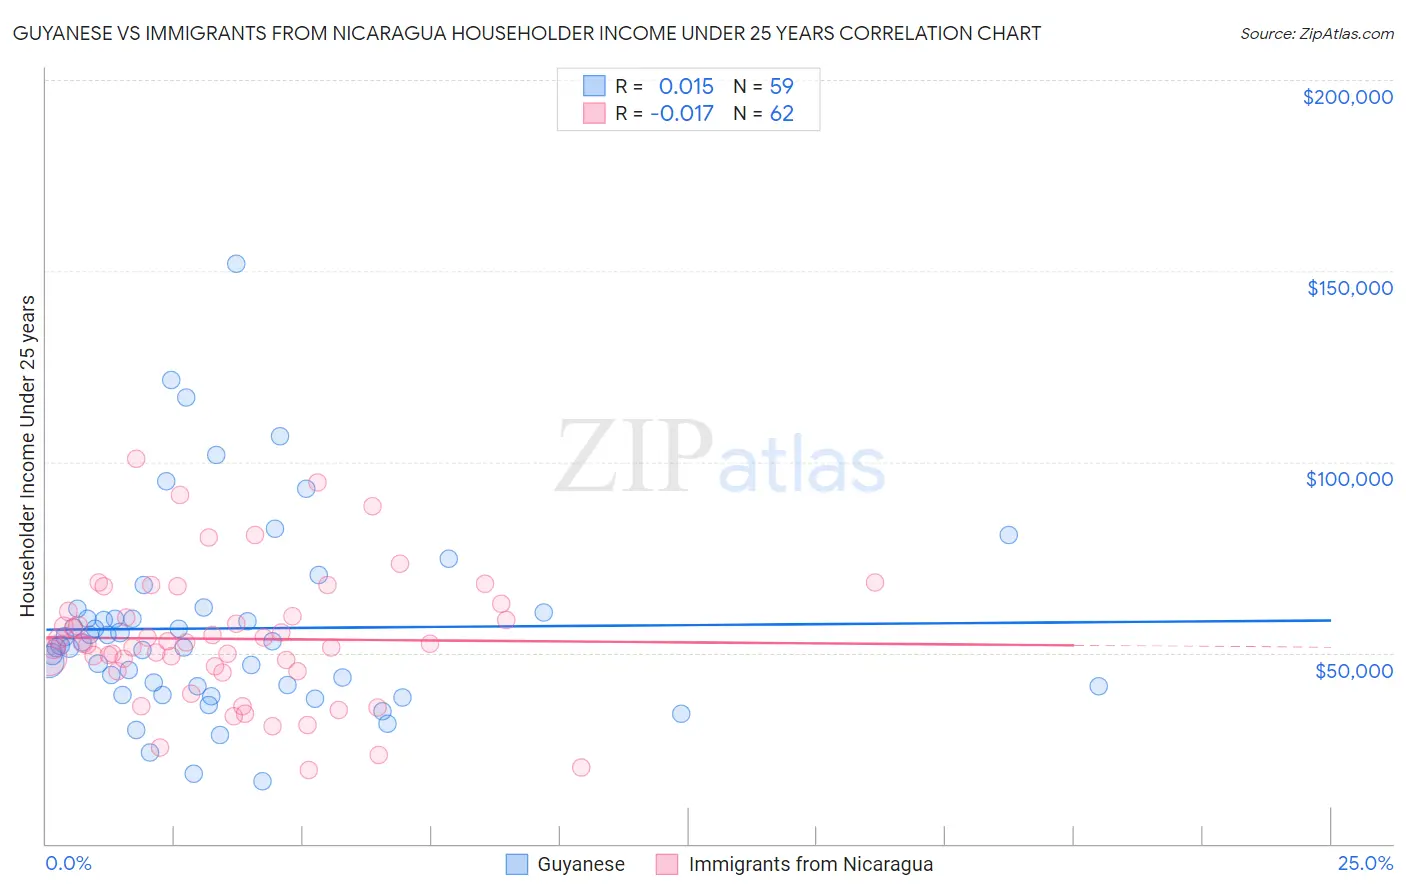
Guyanese vs Immigrants from Nicaragua Householder Income Under 25 years Correlation Chart
The statistical analysis conducted on geographies consisting of 154,823,107 people shows no correlation between the proportion of Guyanese and household income with householder under the age of 25 in the United States with a correlation coefficient (R) of 0.015 and weighted average of $55,210. Similarly, the statistical analysis conducted on geographies consisting of 209,989,839 people shows no correlation between the proportion of Immigrants from Nicaragua and household income with householder under the age of 25 in the United States with a correlation coefficient (R) of -0.017 and weighted average of $53,266, a difference of 3.6%.
Householder Income Under 25 years Correlation Summary
| Measurement | Guyanese | Immigrants from Nicaragua |
| Minimum | $16,250 | $19,455 |
| Maximum | $151,864 | $100,948 |
| Range | $135,614 | $81,493 |
| Mean | $56,409 | $53,656 |
| Median | $51,977 | $52,382 |
| Interquartile 25% (IQ1) | $41,119 | $45,288 |
| Interquartile 75% (IQ3) | $60,617 | $60,822 |
| Interquartile Range (IQR) | $19,498 | $15,534 |
| Standard Deviation (Sample) | $25,406 | $17,142 |
| Standard Deviation (Population) | $25,190 | $17,003 |
Similar Demographics by Householder Income Under 25 years
Demographics Similar to Guyanese by Householder Income Under 25 years
In terms of householder income under 25 years, the demographic groups most similar to Guyanese are Native Hawaiian ($55,158, a difference of 0.090%), Soviet Union ($55,340, a difference of 0.24%), Immigrants from Lithuania ($55,028, a difference of 0.33%), Immigrants from Europe ($55,022, a difference of 0.34%), and Salvadoran ($55,412, a difference of 0.37%).
| Demographics | Rating | Rank | Householder Income Under 25 years |
| Immigrants | Romania | 100.0 /100 | #51 | Exceptional $55,522 |
| Immigrants | Indonesia | 100.0 /100 | #52 | Exceptional $55,521 |
| Immigrants | Poland | 100.0 /100 | #53 | Exceptional $55,474 |
| Sri Lankans | 100.0 /100 | #54 | Exceptional $55,470 |
| Immigrants | Ukraine | 100.0 /100 | #55 | Exceptional $55,447 |
| Salvadorans | 100.0 /100 | #56 | Exceptional $55,412 |
| Soviet Union | 100.0 /100 | #57 | Exceptional $55,340 |
| Guyanese | 99.9 /100 | #58 | Exceptional $55,210 |
| Native Hawaiians | 99.9 /100 | #59 | Exceptional $55,158 |
| Immigrants | Lithuania | 99.9 /100 | #60 | Exceptional $55,028 |
| Immigrants | Europe | 99.9 /100 | #61 | Exceptional $55,022 |
| Immigrants | Uzbekistan | 99.8 /100 | #62 | Exceptional $54,846 |
| Immigrants | Belgium | 99.8 /100 | #63 | Exceptional $54,830 |
| Burmese | 99.8 /100 | #64 | Exceptional $54,800 |
| Yup'ik | 99.8 /100 | #65 | Exceptional $54,732 |
Demographics Similar to Immigrants from Nicaragua by Householder Income Under 25 years
In terms of householder income under 25 years, the demographic groups most similar to Immigrants from Nicaragua are Nicaraguan ($53,275, a difference of 0.020%), Moroccan ($53,256, a difference of 0.020%), New Zealander ($53,294, a difference of 0.050%), Immigrants from Bulgaria ($53,305, a difference of 0.070%), and Immigrants from North America ($53,307, a difference of 0.080%).
| Demographics | Rating | Rank | Householder Income Under 25 years |
| Colombians | 94.6 /100 | #124 | Exceptional $53,357 |
| Pakistanis | 94.1 /100 | #125 | Exceptional $53,325 |
| Immigrants | Serbia | 94.1 /100 | #126 | Exceptional $53,321 |
| Immigrants | North America | 93.9 /100 | #127 | Exceptional $53,307 |
| Immigrants | Bulgaria | 93.9 /100 | #128 | Exceptional $53,305 |
| New Zealanders | 93.7 /100 | #129 | Exceptional $53,294 |
| Nicaraguans | 93.4 /100 | #130 | Exceptional $53,275 |
| Immigrants | Nicaragua | 93.3 /100 | #131 | Exceptional $53,266 |
| Moroccans | 93.1 /100 | #132 | Exceptional $53,256 |
| Immigrants | Immigrants | 92.2 /100 | #133 | Exceptional $53,201 |
| Immigrants | Northern Africa | 91.9 /100 | #134 | Exceptional $53,185 |
| Chileans | 91.9 /100 | #135 | Exceptional $53,185 |
| Armenians | 91.8 /100 | #136 | Exceptional $53,179 |
| Immigrants | Barbados | 91.5 /100 | #137 | Exceptional $53,163 |
| Norwegians | 90.8 /100 | #138 | Exceptional $53,127 |