Guatemalan vs Dutch Householder Income Over 65 years
COMPARE
Guatemalan
Dutch
Householder Income Over 65 years
Householder Income Over 65 years Comparison
Guatemalans
Dutch
$54,526
HOUSEHOLDER INCOME OVER 65 YEARS
0.1/ 100
METRIC RATING
267th/ 347
METRIC RANK
$59,539
HOUSEHOLDER INCOME OVER 65 YEARS
18.3/ 100
METRIC RATING
201st/ 347
METRIC RANK
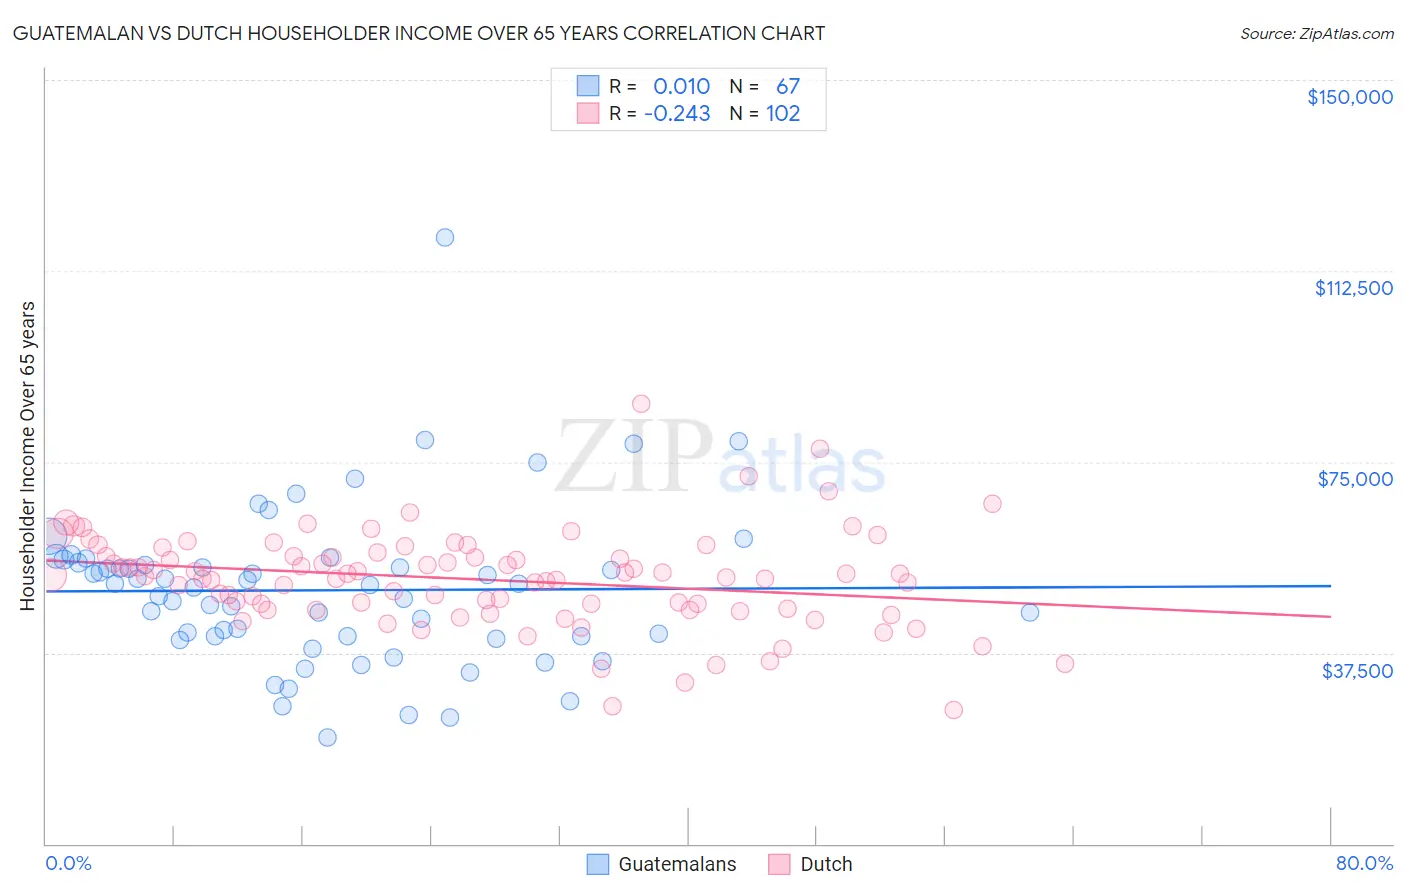
Guatemalan vs Dutch Householder Income Over 65 years Correlation Chart
The statistical analysis conducted on geographies consisting of 407,984,309 people shows no correlation between the proportion of Guatemalans and household income with householder over the age of 65 in the United States with a correlation coefficient (R) of 0.010 and weighted average of $54,526. Similarly, the statistical analysis conducted on geographies consisting of 550,167,438 people shows a weak negative correlation between the proportion of Dutch and household income with householder over the age of 65 in the United States with a correlation coefficient (R) of -0.243 and weighted average of $59,539, a difference of 9.2%.
Householder Income Over 65 years Correlation Summary
| Measurement | Guatemalan | Dutch |
| Minimum | $20,921 | $26,250 |
| Maximum | $119,087 | $86,382 |
| Range | $98,166 | $60,132 |
| Mean | $49,790 | $51,927 |
| Median | $50,748 | $52,693 |
| Interquartile 25% (IQ1) | $40,636 | $46,259 |
| Interquartile 75% (IQ3) | $55,201 | $56,502 |
| Interquartile Range (IQR) | $14,565 | $10,242 |
| Standard Deviation (Sample) | $15,581 | $9,453 |
| Standard Deviation (Population) | $15,464 | $9,406 |
Similar Demographics by Householder Income Over 65 years
Demographics Similar to Guatemalans by Householder Income Over 65 years
In terms of householder income over 65 years, the demographic groups most similar to Guatemalans are Immigrants from Zaire ($54,512, a difference of 0.030%), Jamaican ($54,560, a difference of 0.060%), Belizean ($54,580, a difference of 0.10%), Nicaraguan ($54,474, a difference of 0.10%), and Immigrants from Senegal ($54,447, a difference of 0.15%).
| Demographics | Rating | Rank | Householder Income Over 65 years |
| Immigrants | West Indies | 0.2 /100 | #260 | Tragic $54,927 |
| Comanche | 0.2 /100 | #261 | Tragic $54,922 |
| Bangladeshis | 0.1 /100 | #262 | Tragic $54,719 |
| French American Indians | 0.1 /100 | #263 | Tragic $54,699 |
| Apache | 0.1 /100 | #264 | Tragic $54,668 |
| Belizeans | 0.1 /100 | #265 | Tragic $54,580 |
| Jamaicans | 0.1 /100 | #266 | Tragic $54,560 |
| Guatemalans | 0.1 /100 | #267 | Tragic $54,526 |
| Immigrants | Zaire | 0.1 /100 | #268 | Tragic $54,512 |
| Nicaraguans | 0.1 /100 | #269 | Tragic $54,474 |
| Immigrants | Senegal | 0.1 /100 | #270 | Tragic $54,447 |
| Liberians | 0.1 /100 | #271 | Tragic $54,356 |
| Potawatomi | 0.1 /100 | #272 | Tragic $54,212 |
| Indonesians | 0.1 /100 | #273 | Tragic $54,176 |
| Barbadians | 0.1 /100 | #274 | Tragic $54,163 |
Demographics Similar to Dutch by Householder Income Over 65 years
In terms of householder income over 65 years, the demographic groups most similar to Dutch are Finnish ($59,535, a difference of 0.010%), Scotch-Irish ($59,447, a difference of 0.15%), Immigrants ($59,656, a difference of 0.20%), French ($59,656, a difference of 0.20%), and Moroccan ($59,683, a difference of 0.24%).
| Demographics | Rating | Rank | Householder Income Over 65 years |
| Immigrants | Africa | 23.4 /100 | #194 | Fair $59,837 |
| Immigrants | Iraq | 23.2 /100 | #195 | Fair $59,824 |
| Germans | 21.5 /100 | #196 | Fair $59,730 |
| Immigrants | Kenya | 21.1 /100 | #197 | Fair $59,710 |
| Moroccans | 20.7 /100 | #198 | Fair $59,683 |
| Immigrants | Immigrants | 20.2 /100 | #199 | Fair $59,656 |
| French | 20.2 /100 | #200 | Fair $59,656 |
| Dutch | 18.3 /100 | #201 | Poor $59,539 |
| Finns | 18.2 /100 | #202 | Poor $59,535 |
| Scotch-Irish | 16.9 /100 | #203 | Poor $59,447 |
| Arapaho | 16.0 /100 | #204 | Poor $59,383 |
| Immigrants | Sudan | 14.2 /100 | #205 | Poor $59,248 |
| Immigrants | South America | 13.0 /100 | #206 | Poor $59,151 |
| Salvadorans | 12.9 /100 | #207 | Poor $59,141 |
| Uruguayans | 12.3 /100 | #208 | Poor $59,090 |