Greek vs Native/Alaskan Householder Income Under 25 years
COMPARE
Greek
Native/Alaskan
Householder Income Under 25 years
Householder Income Under 25 years Comparison
Greeks
Natives/Alaskans
$53,715
HOUSEHOLDER INCOME UNDER 25 YEARS
97.7/ 100
METRIC RATING
110th/ 347
METRIC RANK
$47,704
HOUSEHOLDER INCOME UNDER 25 YEARS
0.0/ 100
METRIC RATING
306th/ 347
METRIC RANK
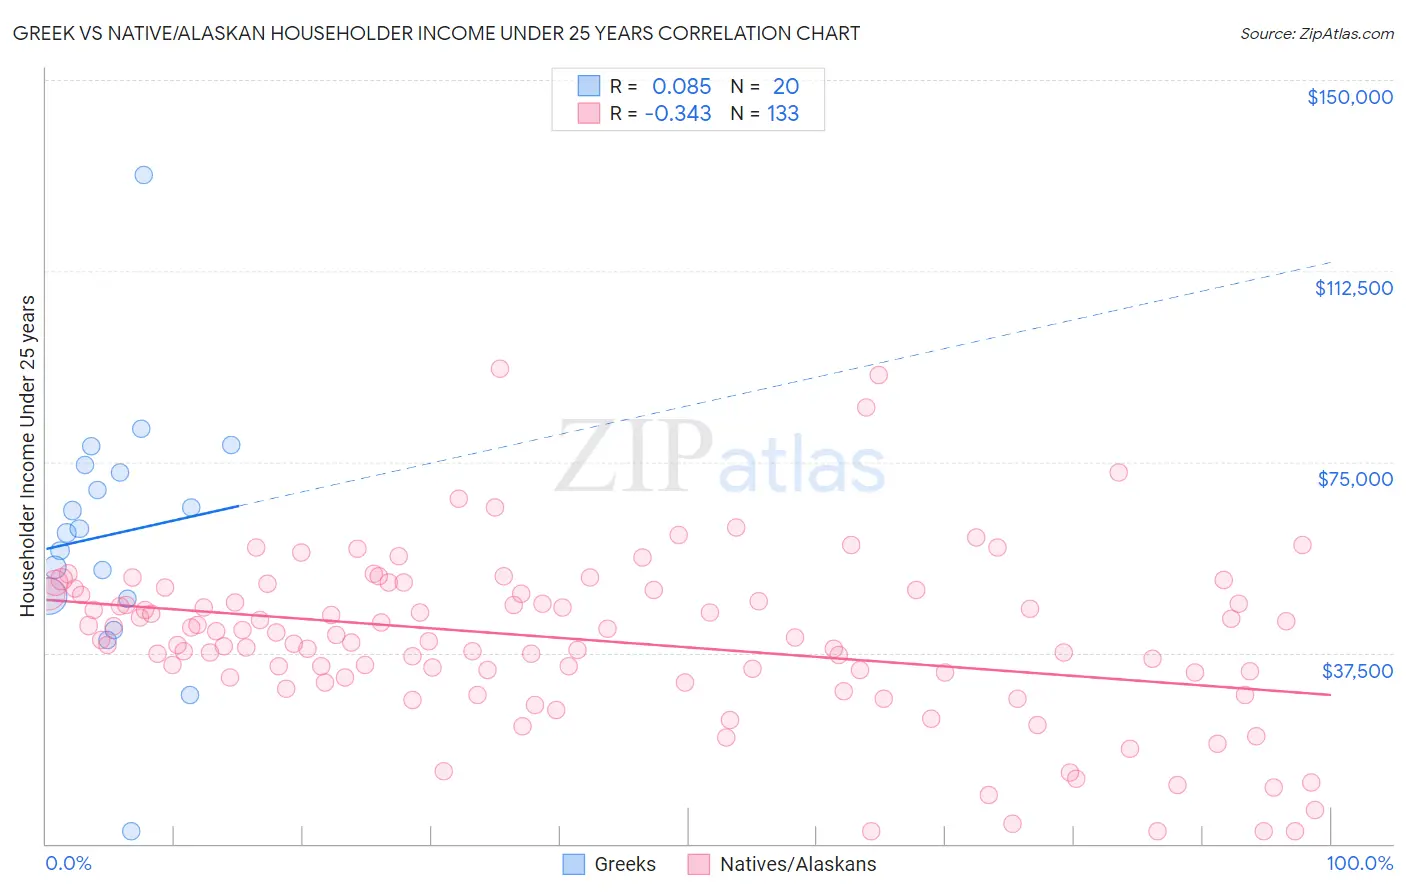
Greek vs Native/Alaskan Householder Income Under 25 years Correlation Chart
The statistical analysis conducted on geographies consisting of 391,360,962 people shows a slight positive correlation between the proportion of Greeks and household income with householder under the age of 25 in the United States with a correlation coefficient (R) of 0.085 and weighted average of $53,715. Similarly, the statistical analysis conducted on geographies consisting of 416,135,889 people shows a mild negative correlation between the proportion of Natives/Alaskans and household income with householder under the age of 25 in the United States with a correlation coefficient (R) of -0.343 and weighted average of $47,704, a difference of 12.6%.
Householder Income Under 25 years Correlation Summary
| Measurement | Greek | Native/Alaskan |
| Minimum | $2,499 | $2,499 |
| Maximum | $131,250 | $93,365 |
| Range | $128,751 | $90,866 |
| Mean | $60,821 | $40,011 |
| Median | $61,415 | $40,469 |
| Interquartile 25% (IQ1) | $48,366 | $32,640 |
| Interquartile 75% (IQ3) | $73,725 | $49,547 |
| Interquartile Range (IQR) | $25,359 | $16,907 |
| Standard Deviation (Sample) | $25,180 | $16,339 |
| Standard Deviation (Population) | $24,542 | $16,277 |
Similar Demographics by Householder Income Under 25 years
Demographics Similar to Greeks by Householder Income Under 25 years
In terms of householder income under 25 years, the demographic groups most similar to Greeks are Immigrants from Colombia ($53,714, a difference of 0.0%), Immigrants from Ecuador ($53,722, a difference of 0.010%), Australian ($53,739, a difference of 0.040%), Maltese ($53,735, a difference of 0.040%), and Immigrants from Oceania ($53,680, a difference of 0.070%).
| Demographics | Rating | Rank | Householder Income Under 25 years |
| Ukrainians | 98.3 /100 | #103 | Exceptional $53,843 |
| Ethiopians | 98.2 /100 | #104 | Exceptional $53,818 |
| Immigrants | France | 98.1 /100 | #105 | Exceptional $53,805 |
| Albanians | 98.1 /100 | #106 | Exceptional $53,794 |
| Australians | 97.8 /100 | #107 | Exceptional $53,739 |
| Maltese | 97.8 /100 | #108 | Exceptional $53,735 |
| Immigrants | Ecuador | 97.7 /100 | #109 | Exceptional $53,722 |
| Greeks | 97.7 /100 | #110 | Exceptional $53,715 |
| Immigrants | Colombia | 97.7 /100 | #111 | Exceptional $53,714 |
| Immigrants | Oceania | 97.5 /100 | #112 | Exceptional $53,680 |
| Romanians | 97.2 /100 | #113 | Exceptional $53,632 |
| Immigrants | Sweden | 97.1 /100 | #114 | Exceptional $53,621 |
| Immigrants | Albania | 96.9 /100 | #115 | Exceptional $53,597 |
| Immigrants | Spain | 96.6 /100 | #116 | Exceptional $53,560 |
| Lithuanians | 96.6 /100 | #117 | Exceptional $53,552 |
Demographics Similar to Natives/Alaskans by Householder Income Under 25 years
In terms of householder income under 25 years, the demographic groups most similar to Natives/Alaskans are Bangladeshi ($47,589, a difference of 0.24%), Cherokee ($47,848, a difference of 0.30%), Comanche ($47,518, a difference of 0.39%), Menominee ($47,907, a difference of 0.43%), and Immigrants from Middle Africa ($47,916, a difference of 0.44%).
| Demographics | Rating | Rank | Householder Income Under 25 years |
| Immigrants | Honduras | 0.0 /100 | #299 | Tragic $48,267 |
| Immigrants | Somalia | 0.0 /100 | #300 | Tragic $48,135 |
| Immigrants | Kuwait | 0.0 /100 | #301 | Tragic $48,126 |
| Immigrants | Liberia | 0.0 /100 | #302 | Tragic $47,981 |
| Immigrants | Middle Africa | 0.0 /100 | #303 | Tragic $47,916 |
| Menominee | 0.0 /100 | #304 | Tragic $47,907 |
| Cherokee | 0.0 /100 | #305 | Tragic $47,848 |
| Natives/Alaskans | 0.0 /100 | #306 | Tragic $47,704 |
| Bangladeshis | 0.0 /100 | #307 | Tragic $47,589 |
| Comanche | 0.0 /100 | #308 | Tragic $47,518 |
| U.S. Virgin Islanders | 0.0 /100 | #309 | Tragic $47,448 |
| Iroquois | 0.0 /100 | #310 | Tragic $47,380 |
| Ottawa | 0.0 /100 | #311 | Tragic $47,366 |
| Bermudans | 0.0 /100 | #312 | Tragic $47,359 |
| Delaware | 0.0 /100 | #313 | Tragic $47,159 |