Greek vs Comanche Householder Income Under 25 years
COMPARE
Greek
Comanche
Householder Income Under 25 years
Householder Income Under 25 years Comparison
Greeks
Comanche
$53,715
HOUSEHOLDER INCOME UNDER 25 YEARS
97.7/ 100
METRIC RATING
110th/ 347
METRIC RANK
$47,518
HOUSEHOLDER INCOME UNDER 25 YEARS
0.0/ 100
METRIC RATING
308th/ 347
METRIC RANK
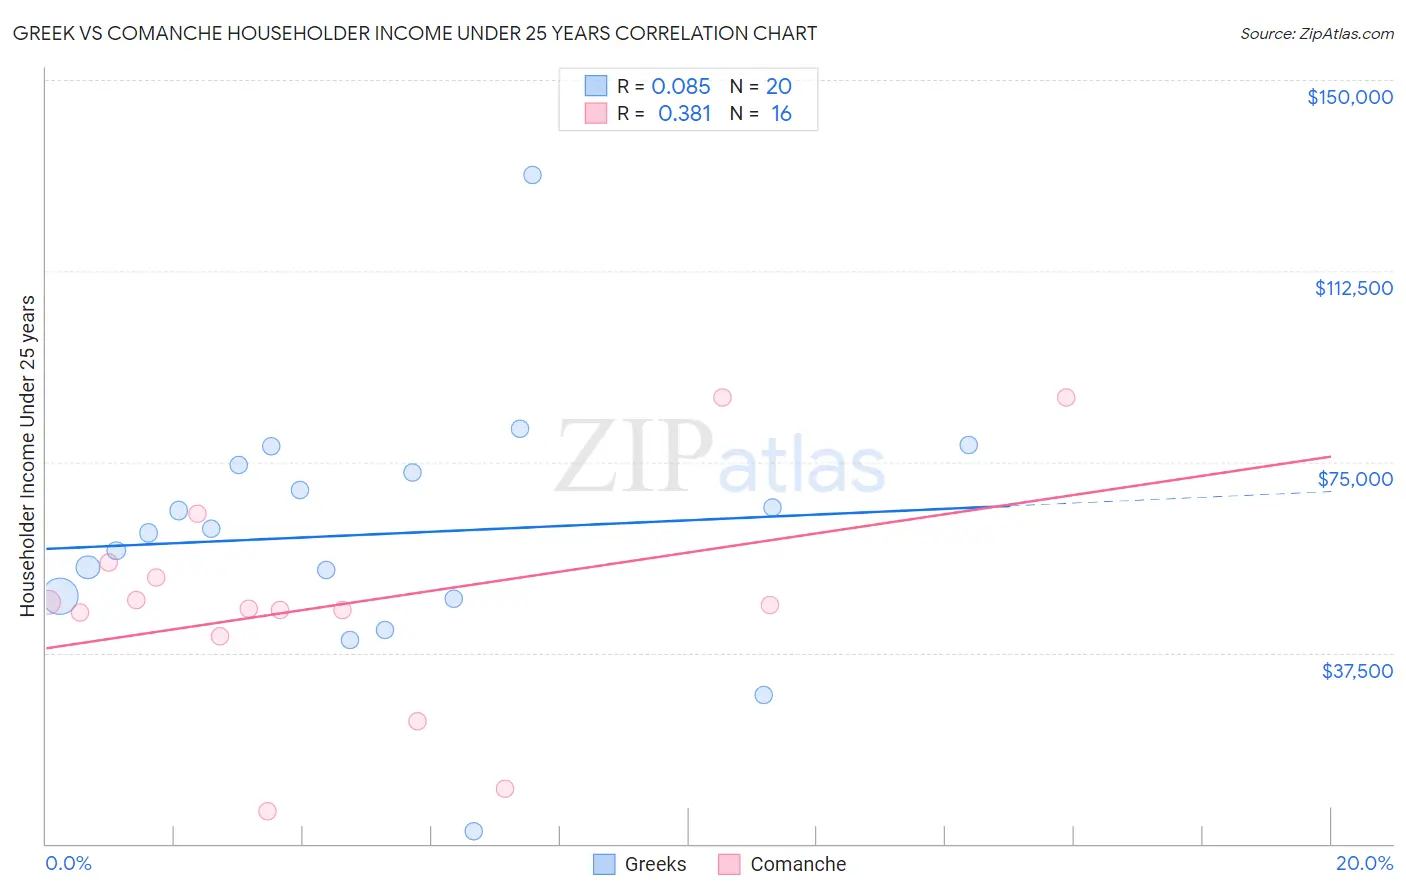
Greek vs Comanche Householder Income Under 25 years Correlation Chart
The statistical analysis conducted on geographies consisting of 391,360,962 people shows a slight positive correlation between the proportion of Greeks and household income with householder under the age of 25 in the United States with a correlation coefficient (R) of 0.085 and weighted average of $53,715. Similarly, the statistical analysis conducted on geographies consisting of 103,551,593 people shows a mild positive correlation between the proportion of Comanche and household income with householder under the age of 25 in the United States with a correlation coefficient (R) of 0.381 and weighted average of $47,518, a difference of 13.0%.
Householder Income Under 25 years Correlation Summary
| Measurement | Greek | Comanche |
| Minimum | $2,499 | $6,484 |
| Maximum | $131,250 | $87,727 |
| Range | $128,751 | $81,243 |
| Mean | $60,821 | $47,234 |
| Median | $61,415 | $46,529 |
| Interquartile 25% (IQ1) | $48,366 | $43,131 |
| Interquartile 75% (IQ3) | $73,725 | $53,745 |
| Interquartile Range (IQR) | $25,359 | $10,614 |
| Standard Deviation (Sample) | $25,180 | $21,985 |
| Standard Deviation (Population) | $24,542 | $21,287 |
Similar Demographics by Householder Income Under 25 years
Demographics Similar to Greeks by Householder Income Under 25 years
In terms of householder income under 25 years, the demographic groups most similar to Greeks are Immigrants from Colombia ($53,714, a difference of 0.0%), Immigrants from Ecuador ($53,722, a difference of 0.010%), Australian ($53,739, a difference of 0.040%), Maltese ($53,735, a difference of 0.040%), and Immigrants from Oceania ($53,680, a difference of 0.070%).
| Demographics | Rating | Rank | Householder Income Under 25 years |
| Ukrainians | 98.3 /100 | #103 | Exceptional $53,843 |
| Ethiopians | 98.2 /100 | #104 | Exceptional $53,818 |
| Immigrants | France | 98.1 /100 | #105 | Exceptional $53,805 |
| Albanians | 98.1 /100 | #106 | Exceptional $53,794 |
| Australians | 97.8 /100 | #107 | Exceptional $53,739 |
| Maltese | 97.8 /100 | #108 | Exceptional $53,735 |
| Immigrants | Ecuador | 97.7 /100 | #109 | Exceptional $53,722 |
| Greeks | 97.7 /100 | #110 | Exceptional $53,715 |
| Immigrants | Colombia | 97.7 /100 | #111 | Exceptional $53,714 |
| Immigrants | Oceania | 97.5 /100 | #112 | Exceptional $53,680 |
| Romanians | 97.2 /100 | #113 | Exceptional $53,632 |
| Immigrants | Sweden | 97.1 /100 | #114 | Exceptional $53,621 |
| Immigrants | Albania | 96.9 /100 | #115 | Exceptional $53,597 |
| Immigrants | Spain | 96.6 /100 | #116 | Exceptional $53,560 |
| Lithuanians | 96.6 /100 | #117 | Exceptional $53,552 |
Demographics Similar to Comanche by Householder Income Under 25 years
In terms of householder income under 25 years, the demographic groups most similar to Comanche are Bangladeshi ($47,589, a difference of 0.15%), U.S. Virgin Islander ($47,448, a difference of 0.15%), Iroquois ($47,380, a difference of 0.29%), Ottawa ($47,366, a difference of 0.32%), and Bermudan ($47,359, a difference of 0.34%).
| Demographics | Rating | Rank | Householder Income Under 25 years |
| Immigrants | Kuwait | 0.0 /100 | #301 | Tragic $48,126 |
| Immigrants | Liberia | 0.0 /100 | #302 | Tragic $47,981 |
| Immigrants | Middle Africa | 0.0 /100 | #303 | Tragic $47,916 |
| Menominee | 0.0 /100 | #304 | Tragic $47,907 |
| Cherokee | 0.0 /100 | #305 | Tragic $47,848 |
| Natives/Alaskans | 0.0 /100 | #306 | Tragic $47,704 |
| Bangladeshis | 0.0 /100 | #307 | Tragic $47,589 |
| Comanche | 0.0 /100 | #308 | Tragic $47,518 |
| U.S. Virgin Islanders | 0.0 /100 | #309 | Tragic $47,448 |
| Iroquois | 0.0 /100 | #310 | Tragic $47,380 |
| Ottawa | 0.0 /100 | #311 | Tragic $47,366 |
| Bermudans | 0.0 /100 | #312 | Tragic $47,359 |
| Delaware | 0.0 /100 | #313 | Tragic $47,159 |
| Chippewa | 0.0 /100 | #314 | Tragic $47,015 |
| Crow | 0.0 /100 | #315 | Tragic $47,012 |