Ghanaian vs Russian Householder Income Under 25 years
COMPARE
Ghanaian
Russian
Householder Income Under 25 years
Householder Income Under 25 years Comparison
Ghanaians
Russians
$52,594
HOUSEHOLDER INCOME UNDER 25 YEARS
72.9/ 100
METRIC RATING
157th/ 347
METRIC RANK
$54,389
HOUSEHOLDER INCOME UNDER 25 YEARS
99.5/ 100
METRIC RATING
82nd/ 347
METRIC RANK
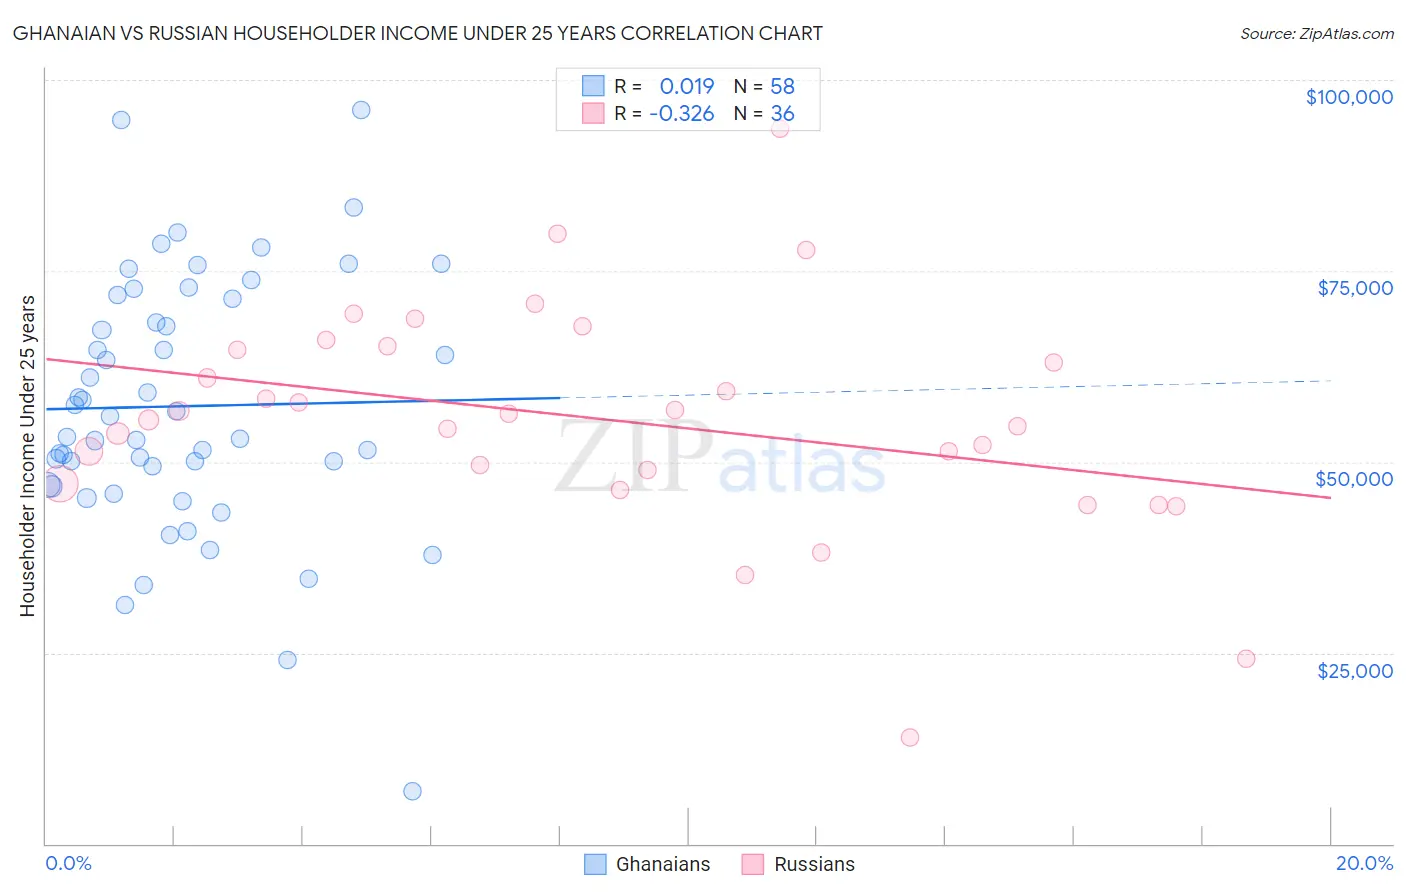
Ghanaian vs Russian Householder Income Under 25 years Correlation Chart
The statistical analysis conducted on geographies consisting of 172,179,779 people shows no correlation between the proportion of Ghanaians and household income with householder under the age of 25 in the United States with a correlation coefficient (R) of 0.019 and weighted average of $52,594. Similarly, the statistical analysis conducted on geographies consisting of 408,933,580 people shows a mild negative correlation between the proportion of Russians and household income with householder under the age of 25 in the United States with a correlation coefficient (R) of -0.326 and weighted average of $54,389, a difference of 3.4%.
Householder Income Under 25 years Correlation Summary
| Measurement | Ghanaian | Russian |
| Minimum | $6,940 | $13,906 |
| Maximum | $96,053 | $93,571 |
| Range | $89,113 | $79,665 |
| Mean | $57,281 | $55,615 |
| Median | $54,641 | $55,875 |
| Interquartile 25% (IQ1) | $46,996 | $48,025 |
| Interquartile 75% (IQ3) | $71,280 | $64,893 |
| Interquartile Range (IQR) | $24,284 | $16,868 |
| Standard Deviation (Sample) | $16,793 | $14,911 |
| Standard Deviation (Population) | $16,648 | $14,703 |
Similar Demographics by Householder Income Under 25 years
Demographics Similar to Ghanaians by Householder Income Under 25 years
In terms of householder income under 25 years, the demographic groups most similar to Ghanaians are Immigrants from Netherlands ($52,592, a difference of 0.0%), Immigrants from Nepal ($52,611, a difference of 0.030%), Immigrants from Denmark ($52,612, a difference of 0.040%), Immigrants from the Azores ($52,621, a difference of 0.050%), and Central American ($52,626, a difference of 0.060%).
| Demographics | Rating | Rank | Householder Income Under 25 years |
| Immigrants | Costa Rica | 75.2 /100 | #150 | Good $52,643 |
| Immigrants | Scotland | 75.0 /100 | #151 | Good $52,638 |
| Trinidadians and Tobagonians | 74.6 /100 | #152 | Good $52,631 |
| Central Americans | 74.4 /100 | #153 | Good $52,626 |
| Immigrants | Azores | 74.2 /100 | #154 | Good $52,621 |
| Immigrants | Denmark | 73.8 /100 | #155 | Good $52,612 |
| Immigrants | Nepal | 73.7 /100 | #156 | Good $52,611 |
| Ghanaians | 72.9 /100 | #157 | Good $52,594 |
| Immigrants | Netherlands | 72.8 /100 | #158 | Good $52,592 |
| Mongolians | 70.2 /100 | #159 | Good $52,540 |
| Immigrants | Turkey | 68.3 /100 | #160 | Good $52,503 |
| Uruguayans | 66.2 /100 | #161 | Good $52,465 |
| Immigrants | Cambodia | 65.4 /100 | #162 | Good $52,450 |
| Immigrants | Chile | 64.8 /100 | #163 | Good $52,440 |
| Immigrants | Trinidad and Tobago | 64.7 /100 | #164 | Good $52,437 |
Demographics Similar to Russians by Householder Income Under 25 years
In terms of householder income under 25 years, the demographic groups most similar to Russians are Laotian ($54,369, a difference of 0.040%), Bulgarian ($54,352, a difference of 0.070%), Immigrants from Czechoslovakia ($54,352, a difference of 0.070%), Portuguese ($54,436, a difference of 0.090%), and Immigrants from Croatia ($54,343, a difference of 0.090%).
| Demographics | Rating | Rank | Householder Income Under 25 years |
| Immigrants | Sri Lanka | 99.7 /100 | #75 | Exceptional $54,512 |
| Immigrants | Brazil | 99.6 /100 | #76 | Exceptional $54,487 |
| Immigrants | Southern Europe | 99.6 /100 | #77 | Exceptional $54,484 |
| Nepalese | 99.6 /100 | #78 | Exceptional $54,472 |
| Immigrants | Italy | 99.6 /100 | #79 | Exceptional $54,449 |
| Egyptians | 99.6 /100 | #80 | Exceptional $54,444 |
| Portuguese | 99.6 /100 | #81 | Exceptional $54,436 |
| Russians | 99.5 /100 | #82 | Exceptional $54,389 |
| Laotians | 99.5 /100 | #83 | Exceptional $54,369 |
| Bulgarians | 99.5 /100 | #84 | Exceptional $54,352 |
| Immigrants | Czechoslovakia | 99.5 /100 | #85 | Exceptional $54,352 |
| Immigrants | Croatia | 99.5 /100 | #86 | Exceptional $54,343 |
| Brazilians | 99.5 /100 | #87 | Exceptional $54,335 |
| Yakama | 99.5 /100 | #88 | Exceptional $54,321 |
| Immigrants | South America | 99.4 /100 | #89 | Exceptional $54,268 |