Ghanaian vs Immigrants from England Householder Income Under 25 years
COMPARE
Ghanaian
Immigrants from England
Householder Income Under 25 years
Householder Income Under 25 years Comparison
Ghanaians
Immigrants from England
$52,594
HOUSEHOLDER INCOME UNDER 25 YEARS
72.9/ 100
METRIC RATING
157th/ 347
METRIC RANK
$51,817
HOUSEHOLDER INCOME UNDER 25 YEARS
28.7/ 100
METRIC RATING
180th/ 347
METRIC RANK
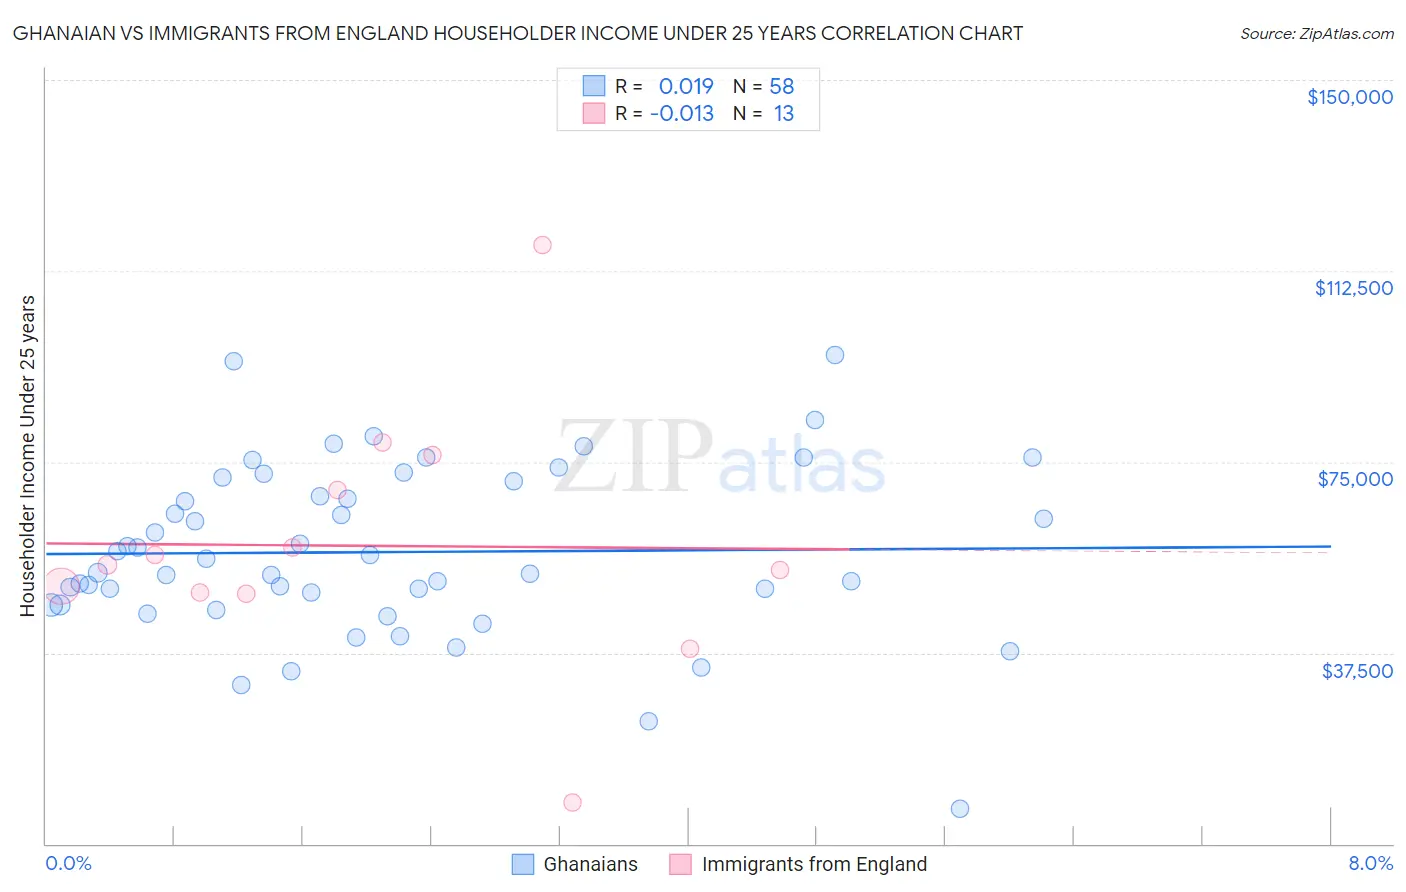
Ghanaian vs Immigrants from England Householder Income Under 25 years Correlation Chart
The statistical analysis conducted on geographies consisting of 172,179,779 people shows no correlation between the proportion of Ghanaians and household income with householder under the age of 25 in the United States with a correlation coefficient (R) of 0.019 and weighted average of $52,594. Similarly, the statistical analysis conducted on geographies consisting of 326,167,300 people shows no correlation between the proportion of Immigrants from England and household income with householder under the age of 25 in the United States with a correlation coefficient (R) of -0.013 and weighted average of $51,817, a difference of 1.5%.
Householder Income Under 25 years Correlation Summary
| Measurement | Ghanaian | Immigrants from England |
| Minimum | $6,940 | $8,124 |
| Maximum | $96,053 | $117,638 |
| Range | $89,113 | $109,515 |
| Mean | $57,281 | $58,520 |
| Median | $54,641 | $54,780 |
| Interquartile 25% (IQ1) | $46,996 | $49,205 |
| Interquartile 75% (IQ3) | $71,280 | $72,891 |
| Interquartile Range (IQR) | $24,284 | $23,686 |
| Standard Deviation (Sample) | $16,793 | $25,115 |
| Standard Deviation (Population) | $16,648 | $24,130 |
Similar Demographics by Householder Income Under 25 years
Demographics Similar to Ghanaians by Householder Income Under 25 years
In terms of householder income under 25 years, the demographic groups most similar to Ghanaians are Immigrants from Netherlands ($52,592, a difference of 0.0%), Immigrants from Nepal ($52,611, a difference of 0.030%), Immigrants from Denmark ($52,612, a difference of 0.040%), Immigrants from the Azores ($52,621, a difference of 0.050%), and Central American ($52,626, a difference of 0.060%).
| Demographics | Rating | Rank | Householder Income Under 25 years |
| Immigrants | Costa Rica | 75.2 /100 | #150 | Good $52,643 |
| Immigrants | Scotland | 75.0 /100 | #151 | Good $52,638 |
| Trinidadians and Tobagonians | 74.6 /100 | #152 | Good $52,631 |
| Central Americans | 74.4 /100 | #153 | Good $52,626 |
| Immigrants | Azores | 74.2 /100 | #154 | Good $52,621 |
| Immigrants | Denmark | 73.8 /100 | #155 | Good $52,612 |
| Immigrants | Nepal | 73.7 /100 | #156 | Good $52,611 |
| Ghanaians | 72.9 /100 | #157 | Good $52,594 |
| Immigrants | Netherlands | 72.8 /100 | #158 | Good $52,592 |
| Mongolians | 70.2 /100 | #159 | Good $52,540 |
| Immigrants | Turkey | 68.3 /100 | #160 | Good $52,503 |
| Uruguayans | 66.2 /100 | #161 | Good $52,465 |
| Immigrants | Cambodia | 65.4 /100 | #162 | Good $52,450 |
| Immigrants | Chile | 64.8 /100 | #163 | Good $52,440 |
| Immigrants | Trinidad and Tobago | 64.7 /100 | #164 | Good $52,437 |
Demographics Similar to Immigrants from England by Householder Income Under 25 years
In terms of householder income under 25 years, the demographic groups most similar to Immigrants from England are Basque ($51,818, a difference of 0.0%), Finnish ($51,827, a difference of 0.020%), European ($51,796, a difference of 0.040%), Jordanian ($51,796, a difference of 0.040%), and British West Indian ($51,844, a difference of 0.050%).
| Demographics | Rating | Rank | Householder Income Under 25 years |
| Barbadians | 50.8 /100 | #173 | Average $52,202 |
| Immigrants | Western Asia | 50.0 /100 | #174 | Average $52,190 |
| Immigrants | Zimbabwe | 33.8 /100 | #175 | Fair $51,914 |
| Austrians | 32.9 /100 | #176 | Fair $51,898 |
| British West Indians | 30.0 /100 | #177 | Fair $51,844 |
| Finns | 29.2 /100 | #178 | Fair $51,827 |
| Basques | 28.7 /100 | #179 | Fair $51,818 |
| Immigrants | England | 28.7 /100 | #180 | Fair $51,817 |
| Europeans | 27.6 /100 | #181 | Fair $51,796 |
| Jordanians | 27.6 /100 | #182 | Fair $51,796 |
| Mexican American Indians | 27.0 /100 | #183 | Fair $51,783 |
| Paiute | 25.1 /100 | #184 | Fair $51,743 |
| Immigrants | Latvia | 24.8 /100 | #185 | Fair $51,737 |
| Alaskan Athabascans | 23.8 /100 | #186 | Fair $51,713 |
| Immigrants | South Africa | 23.4 /100 | #187 | Fair $51,705 |