German vs Palestinian Median Family Income
COMPARE
German
Palestinian
Median Family Income
Median Family Income Comparison
Germans
Palestinians
$102,254
MEDIAN FAMILY INCOME
44.6/ 100
METRIC RATING
177th/ 347
METRIC RANK
$109,413
MEDIAN FAMILY INCOME
96.9/ 100
METRIC RATING
104th/ 347
METRIC RANK
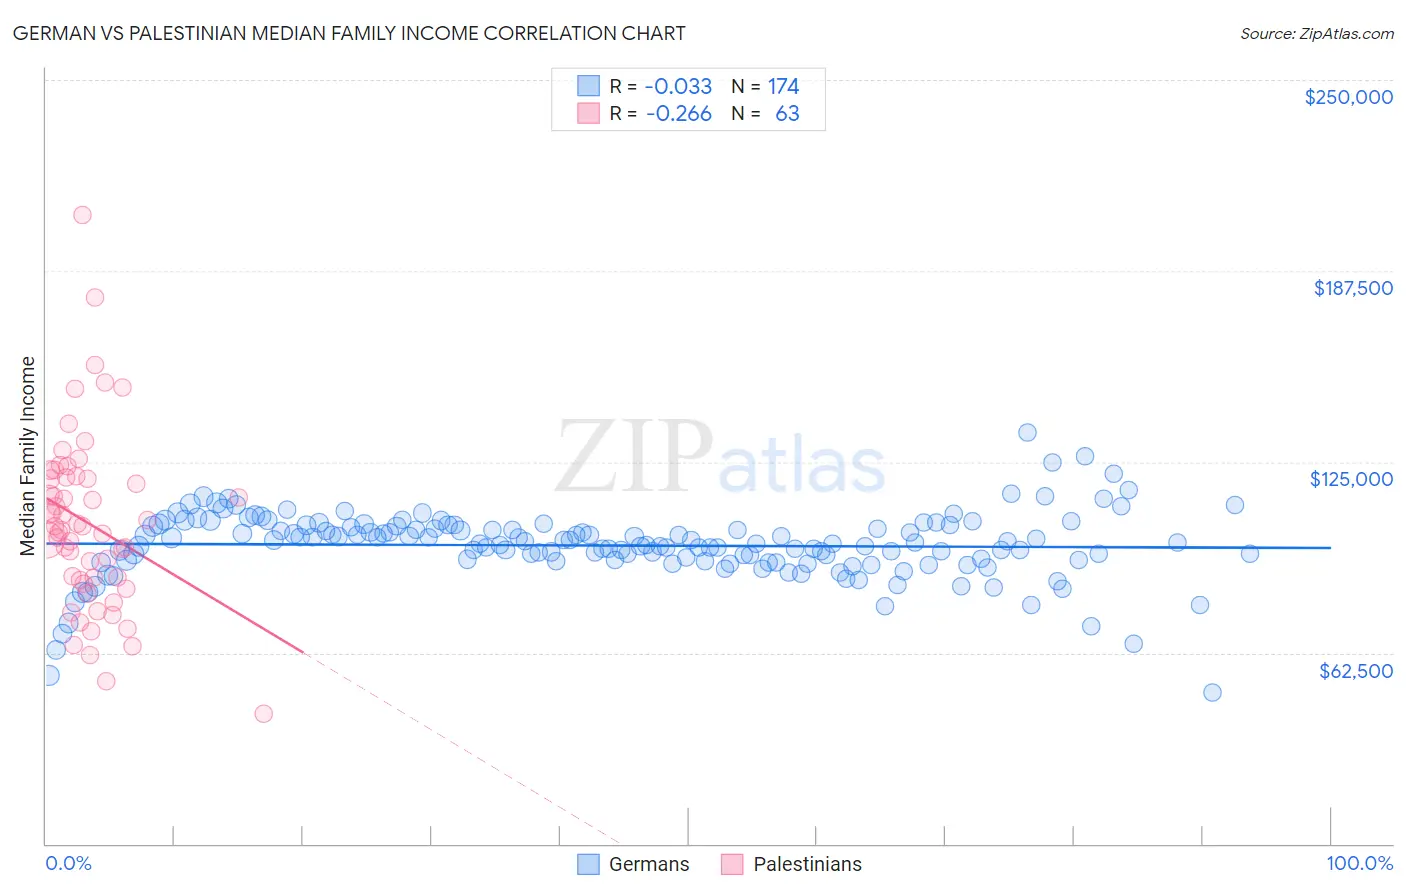
German vs Palestinian Median Family Income Correlation Chart
The statistical analysis conducted on geographies consisting of 579,235,453 people shows no correlation between the proportion of Germans and median family income in the United States with a correlation coefficient (R) of -0.033 and weighted average of $102,254. Similarly, the statistical analysis conducted on geographies consisting of 216,343,978 people shows a weak negative correlation between the proportion of Palestinians and median family income in the United States with a correlation coefficient (R) of -0.266 and weighted average of $109,413, a difference of 7.0%.
Median Family Income Correlation Summary
| Measurement | German | Palestinian |
| Minimum | $49,444 | $42,500 |
| Maximum | $134,628 | $205,817 |
| Range | $85,184 | $163,317 |
| Mean | $97,641 | $104,822 |
| Median | $98,482 | $104,046 |
| Interquartile 25% (IQ1) | $92,833 | $86,157 |
| Interquartile 75% (IQ3) | $104,084 | $120,000 |
| Interquartile Range (IQR) | $11,251 | $33,843 |
| Standard Deviation (Sample) | $11,245 | $28,885 |
| Standard Deviation (Population) | $11,212 | $28,655 |
Similar Demographics by Median Family Income
Demographics Similar to Germans by Median Family Income
In terms of median family income, the demographic groups most similar to Germans are Welsh ($102,151, a difference of 0.10%), French ($102,368, a difference of 0.11%), Immigrants from Eastern Africa ($102,451, a difference of 0.19%), South American ($101,856, a difference of 0.39%), and Finnish ($102,676, a difference of 0.41%).
| Demographics | Rating | Rank | Median Family Income |
| Immigrants | Uzbekistan | 56.6 /100 | #170 | Average $103,197 |
| Alsatians | 54.3 /100 | #171 | Average $103,010 |
| Immigrants | Eritrea | 51.9 /100 | #172 | Average $102,823 |
| Belgians | 51.4 /100 | #173 | Average $102,788 |
| Finns | 50.0 /100 | #174 | Average $102,676 |
| Immigrants | Eastern Africa | 47.1 /100 | #175 | Average $102,451 |
| French | 46.1 /100 | #176 | Average $102,368 |
| Germans | 44.6 /100 | #177 | Average $102,254 |
| Welsh | 43.3 /100 | #178 | Average $102,151 |
| South Americans | 39.7 /100 | #179 | Fair $101,856 |
| French Canadians | 37.0 /100 | #180 | Fair $101,634 |
| Spaniards | 36.8 /100 | #181 | Fair $101,617 |
| Tsimshian | 35.9 /100 | #182 | Fair $101,543 |
| Kenyans | 34.5 /100 | #183 | Fair $101,417 |
| Immigrants | Costa Rica | 33.7 /100 | #184 | Fair $101,354 |
Demographics Similar to Palestinians by Median Family Income
In terms of median family income, the demographic groups most similar to Palestinians are Immigrants from Brazil ($109,418, a difference of 0.0%), Syrian ($109,299, a difference of 0.10%), Assyrian/Chaldean/Syriac ($109,622, a difference of 0.19%), Immigrants from Ukraine ($109,645, a difference of 0.21%), and Macedonian ($109,668, a difference of 0.23%).
| Demographics | Rating | Rank | Median Family Income |
| Jordanians | 97.5 /100 | #97 | Exceptional $109,865 |
| Immigrants | Kuwait | 97.4 /100 | #98 | Exceptional $109,731 |
| Armenians | 97.3 /100 | #99 | Exceptional $109,692 |
| Macedonians | 97.3 /100 | #100 | Exceptional $109,668 |
| Immigrants | Ukraine | 97.2 /100 | #101 | Exceptional $109,645 |
| Assyrians/Chaldeans/Syriacs | 97.2 /100 | #102 | Exceptional $109,622 |
| Immigrants | Brazil | 96.9 /100 | #103 | Exceptional $109,418 |
| Palestinians | 96.9 /100 | #104 | Exceptional $109,413 |
| Syrians | 96.7 /100 | #105 | Exceptional $109,299 |
| Albanians | 96.4 /100 | #106 | Exceptional $109,136 |
| Immigrants | North Macedonia | 96.4 /100 | #107 | Exceptional $109,136 |
| Immigrants | Zimbabwe | 95.9 /100 | #108 | Exceptional $108,830 |
| Immigrants | Afghanistan | 95.6 /100 | #109 | Exceptional $108,709 |
| British | 95.6 /100 | #110 | Exceptional $108,705 |
| Immigrants | Western Asia | 95.6 /100 | #111 | Exceptional $108,691 |