French vs White/Caucasian Householder Income Ages 25 - 44 years
COMPARE
French
White/Caucasian
Householder Income Ages 25 - 44 years
Householder Income Ages 25 - 44 years Comparison
French
Whites/Caucasians
$93,665
HOUSEHOLDER INCOME AGES 25 - 44 YEARS
37.8/ 100
METRIC RATING
180th/ 347
METRIC RANK
$91,668
HOUSEHOLDER INCOME AGES 25 - 44 YEARS
16.7/ 100
METRIC RATING
200th/ 347
METRIC RANK
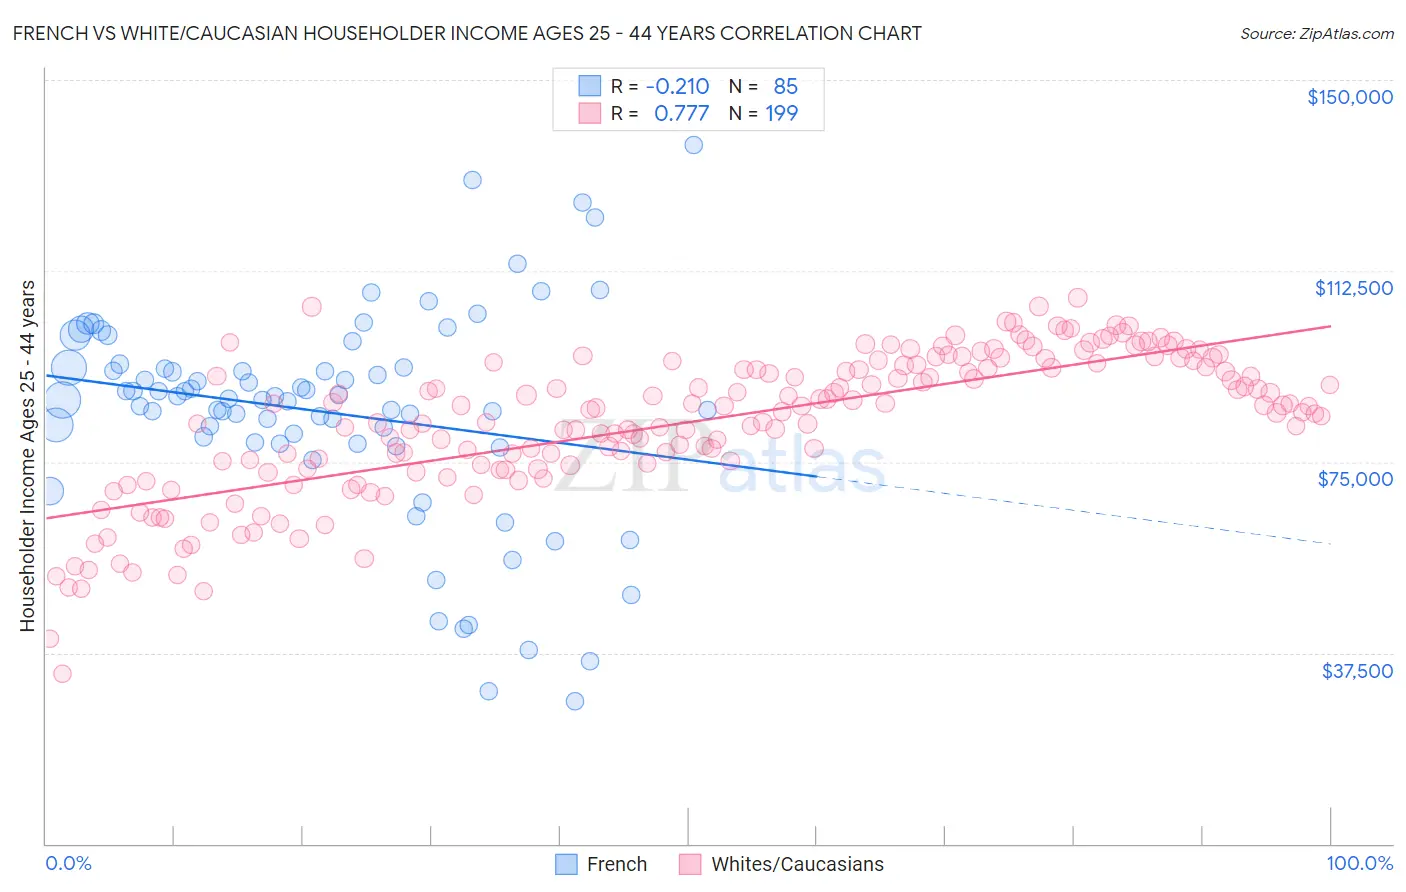
French vs White/Caucasian Householder Income Ages 25 - 44 years Correlation Chart
The statistical analysis conducted on geographies consisting of 566,574,602 people shows a weak negative correlation between the proportion of French and household income with householder between the ages 25 and 44 in the United States with a correlation coefficient (R) of -0.210 and weighted average of $93,665. Similarly, the statistical analysis conducted on geographies consisting of 574,090,694 people shows a strong positive correlation between the proportion of Whites/Caucasians and household income with householder between the ages 25 and 44 in the United States with a correlation coefficient (R) of 0.777 and weighted average of $91,668, a difference of 2.2%.
Householder Income Ages 25 - 44 years Correlation Summary
| Measurement | French | White/Caucasian |
| Minimum | $28,047 | $33,408 |
| Maximum | $137,237 | $107,218 |
| Range | $109,190 | $73,811 |
| Mean | $84,736 | $82,806 |
| Median | $87,325 | $86,008 |
| Interquartile 25% (IQ1) | $78,650 | $74,387 |
| Interquartile 75% (IQ3) | $93,493 | $94,127 |
| Interquartile Range (IQR) | $14,843 | $19,740 |
| Standard Deviation (Sample) | $21,004 | $14,065 |
| Standard Deviation (Population) | $20,880 | $14,029 |
Demographics Similar to French and Whites/Caucasians by Householder Income Ages 25 - 44 years
In terms of householder income ages 25 - 44 years, the demographic groups most similar to French are Puget Sound Salish ($93,661, a difference of 0.0%), Uruguayan ($93,631, a difference of 0.040%), Guamanian/Chamorro ($93,569, a difference of 0.10%), German ($93,531, a difference of 0.14%), and Immigrants from Eritrea ($93,466, a difference of 0.21%). Similarly, the demographic groups most similar to Whites/Caucasians are Kenyan ($91,684, a difference of 0.020%), Vietnamese ($92,089, a difference of 0.46%), Spanish ($92,200, a difference of 0.58%), Immigrants from Colombia ($92,204, a difference of 0.59%), and Celtic ($92,241, a difference of 0.63%).
| Demographics | Rating | Rank | Householder Income Ages 25 - 44 years |
| French | 37.8 /100 | #180 | Fair $93,665 |
| Puget Sound Salish | 37.7 /100 | #181 | Fair $93,661 |
| Uruguayans | 37.3 /100 | #182 | Fair $93,631 |
| Guamanians/Chamorros | 36.5 /100 | #183 | Fair $93,569 |
| Germans | 36.0 /100 | #184 | Fair $93,531 |
| Immigrants | Eritrea | 35.2 /100 | #185 | Fair $93,466 |
| Sierra Leoneans | 34.8 /100 | #186 | Fair $93,435 |
| Spaniards | 34.0 /100 | #187 | Fair $93,366 |
| Immigrants | Sierra Leone | 30.9 /100 | #188 | Fair $93,115 |
| Dutch | 30.5 /100 | #189 | Fair $93,081 |
| Welsh | 30.0 /100 | #190 | Fair $93,039 |
| Tlingit-Haida | 29.4 /100 | #191 | Fair $92,987 |
| Immigrants | Costa Rica | 28.2 /100 | #192 | Fair $92,876 |
| Samoans | 23.0 /100 | #193 | Fair $92,385 |
| Immigrants | Azores | 22.4 /100 | #194 | Fair $92,322 |
| Celtics | 21.6 /100 | #195 | Fair $92,241 |
| Immigrants | Colombia | 21.3 /100 | #196 | Fair $92,204 |
| Spanish | 21.2 /100 | #197 | Fair $92,200 |
| Vietnamese | 20.2 /100 | #198 | Fair $92,089 |
| Kenyans | 16.8 /100 | #199 | Poor $91,684 |
| Whites/Caucasians | 16.7 /100 | #200 | Poor $91,668 |