French vs Spaniard Householder Income Ages 25 - 44 years
COMPARE
French
Spaniard
Householder Income Ages 25 - 44 years
Householder Income Ages 25 - 44 years Comparison
French
Spaniards
$93,665
HOUSEHOLDER INCOME AGES 25 - 44 YEARS
37.8/ 100
METRIC RATING
180th/ 347
METRIC RANK
$93,366
HOUSEHOLDER INCOME AGES 25 - 44 YEARS
34.0/ 100
METRIC RATING
187th/ 347
METRIC RANK
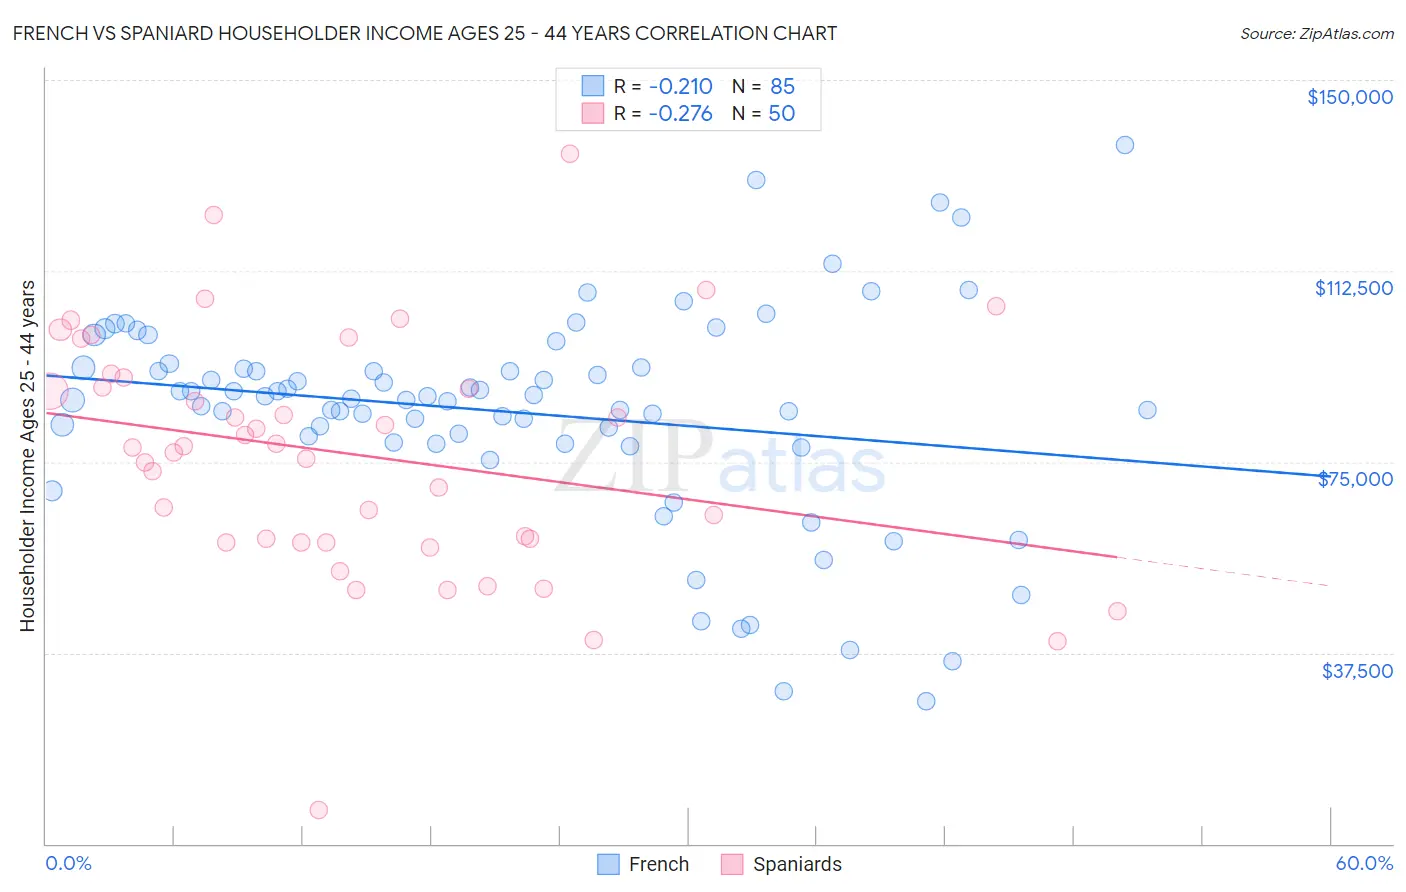
French vs Spaniard Householder Income Ages 25 - 44 years Correlation Chart
The statistical analysis conducted on geographies consisting of 566,574,602 people shows a weak negative correlation between the proportion of French and household income with householder between the ages 25 and 44 in the United States with a correlation coefficient (R) of -0.210 and weighted average of $93,665. Similarly, the statistical analysis conducted on geographies consisting of 441,839,666 people shows a weak negative correlation between the proportion of Spaniards and household income with householder between the ages 25 and 44 in the United States with a correlation coefficient (R) of -0.276 and weighted average of $93,366, a difference of 0.32%.
Householder Income Ages 25 - 44 years Correlation Summary
| Measurement | French | Spaniard |
| Minimum | $28,047 | $6,532 |
| Maximum | $137,237 | $135,588 |
| Range | $109,190 | $129,056 |
| Mean | $84,736 | $76,452 |
| Median | $87,325 | $77,939 |
| Interquartile 25% (IQ1) | $78,650 | $59,278 |
| Interquartile 75% (IQ3) | $93,493 | $91,655 |
| Interquartile Range (IQR) | $14,843 | $32,377 |
| Standard Deviation (Sample) | $21,004 | $23,796 |
| Standard Deviation (Population) | $20,880 | $23,557 |
Demographics Similar to French and Spaniards by Householder Income Ages 25 - 44 years
In terms of householder income ages 25 - 44 years, the demographic groups most similar to French are Puget Sound Salish ($93,661, a difference of 0.0%), French Canadian ($93,694, a difference of 0.030%), Uruguayan ($93,631, a difference of 0.040%), Guamanian/Chamorro ($93,569, a difference of 0.10%), and German ($93,531, a difference of 0.14%). Similarly, the demographic groups most similar to Spaniards are Sierra Leonean ($93,435, a difference of 0.070%), Immigrants from Eritrea ($93,466, a difference of 0.11%), German ($93,531, a difference of 0.18%), Guamanian/Chamorro ($93,569, a difference of 0.22%), and Immigrants from Sierra Leone ($93,115, a difference of 0.27%).
| Demographics | Rating | Rank | Householder Income Ages 25 - 44 years |
| Finns | 50.6 /100 | #173 | Average $94,610 |
| Colombians | 50.0 /100 | #174 | Average $94,565 |
| English | 48.1 /100 | #175 | Average $94,429 |
| Immigrants | Immigrants | 48.0 /100 | #176 | Average $94,423 |
| Belgians | 45.8 /100 | #177 | Average $94,262 |
| Immigrants | South America | 42.8 /100 | #178 | Average $94,042 |
| French Canadians | 38.2 /100 | #179 | Fair $93,694 |
| French | 37.8 /100 | #180 | Fair $93,665 |
| Puget Sound Salish | 37.7 /100 | #181 | Fair $93,661 |
| Uruguayans | 37.3 /100 | #182 | Fair $93,631 |
| Guamanians/Chamorros | 36.5 /100 | #183 | Fair $93,569 |
| Germans | 36.0 /100 | #184 | Fair $93,531 |
| Immigrants | Eritrea | 35.2 /100 | #185 | Fair $93,466 |
| Sierra Leoneans | 34.8 /100 | #186 | Fair $93,435 |
| Spaniards | 34.0 /100 | #187 | Fair $93,366 |
| Immigrants | Sierra Leone | 30.9 /100 | #188 | Fair $93,115 |
| Dutch | 30.5 /100 | #189 | Fair $93,081 |
| Welsh | 30.0 /100 | #190 | Fair $93,039 |
| Tlingit-Haida | 29.4 /100 | #191 | Fair $92,987 |
| Immigrants | Costa Rica | 28.2 /100 | #192 | Fair $92,876 |
| Samoans | 23.0 /100 | #193 | Fair $92,385 |