French vs Immigrants from England Householder Income Ages 25 - 44 years
COMPARE
French
Immigrants from England
Householder Income Ages 25 - 44 years
Householder Income Ages 25 - 44 years Comparison
French
Immigrants from England
$93,665
HOUSEHOLDER INCOME AGES 25 - 44 YEARS
37.8/ 100
METRIC RATING
180th/ 347
METRIC RANK
$102,020
HOUSEHOLDER INCOME AGES 25 - 44 YEARS
98.4/ 100
METRIC RATING
93rd/ 347
METRIC RANK
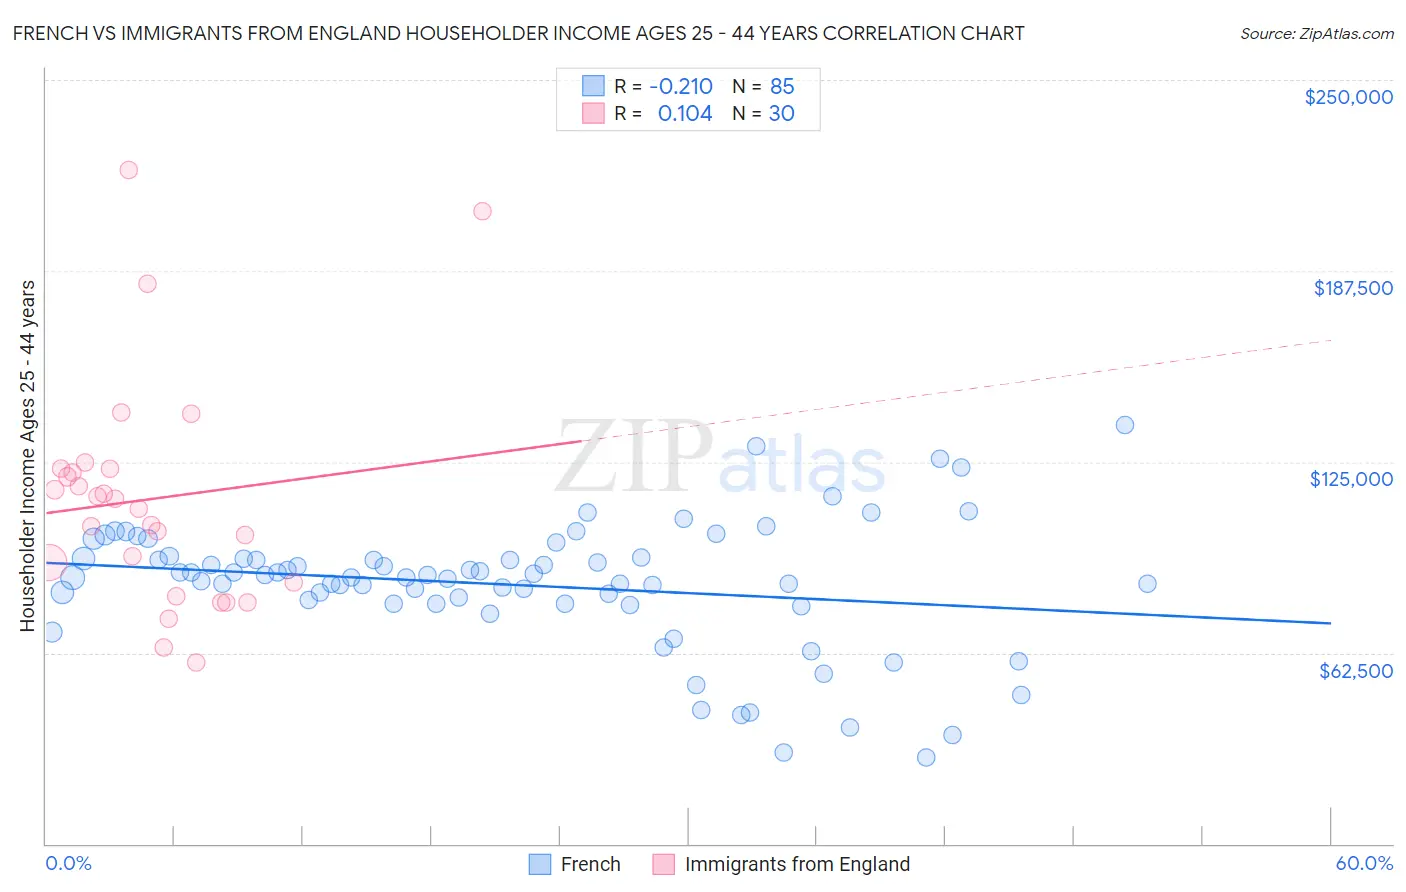
French vs Immigrants from England Householder Income Ages 25 - 44 years Correlation Chart
The statistical analysis conducted on geographies consisting of 566,574,602 people shows a weak negative correlation between the proportion of French and household income with householder between the ages 25 and 44 in the United States with a correlation coefficient (R) of -0.210 and weighted average of $93,665. Similarly, the statistical analysis conducted on geographies consisting of 390,728,278 people shows a poor positive correlation between the proportion of Immigrants from England and household income with householder between the ages 25 and 44 in the United States with a correlation coefficient (R) of 0.104 and weighted average of $102,020, a difference of 8.9%.
Householder Income Ages 25 - 44 years Correlation Summary
| Measurement | French | Immigrants from England |
| Minimum | $28,047 | $59,375 |
| Maximum | $137,237 | $220,451 |
| Range | $109,190 | $161,076 |
| Mean | $84,736 | $112,915 |
| Median | $87,325 | $111,398 |
| Interquartile 25% (IQ1) | $78,650 | $85,313 |
| Interquartile 75% (IQ3) | $93,493 | $122,883 |
| Interquartile Range (IQR) | $14,843 | $37,570 |
| Standard Deviation (Sample) | $21,004 | $37,421 |
| Standard Deviation (Population) | $20,880 | $36,792 |
Similar Demographics by Householder Income Ages 25 - 44 years
Demographics Similar to French by Householder Income Ages 25 - 44 years
In terms of householder income ages 25 - 44 years, the demographic groups most similar to French are Puget Sound Salish ($93,661, a difference of 0.0%), French Canadian ($93,694, a difference of 0.030%), Uruguayan ($93,631, a difference of 0.040%), Guamanian/Chamorro ($93,569, a difference of 0.10%), and German ($93,531, a difference of 0.14%).
| Demographics | Rating | Rank | Householder Income Ages 25 - 44 years |
| Finns | 50.6 /100 | #173 | Average $94,610 |
| Colombians | 50.0 /100 | #174 | Average $94,565 |
| English | 48.1 /100 | #175 | Average $94,429 |
| Immigrants | Immigrants | 48.0 /100 | #176 | Average $94,423 |
| Belgians | 45.8 /100 | #177 | Average $94,262 |
| Immigrants | South America | 42.8 /100 | #178 | Average $94,042 |
| French Canadians | 38.2 /100 | #179 | Fair $93,694 |
| French | 37.8 /100 | #180 | Fair $93,665 |
| Puget Sound Salish | 37.7 /100 | #181 | Fair $93,661 |
| Uruguayans | 37.3 /100 | #182 | Fair $93,631 |
| Guamanians/Chamorros | 36.5 /100 | #183 | Fair $93,569 |
| Germans | 36.0 /100 | #184 | Fair $93,531 |
| Immigrants | Eritrea | 35.2 /100 | #185 | Fair $93,466 |
| Sierra Leoneans | 34.8 /100 | #186 | Fair $93,435 |
| Spaniards | 34.0 /100 | #187 | Fair $93,366 |
Demographics Similar to Immigrants from England by Householder Income Ages 25 - 44 years
In terms of householder income ages 25 - 44 years, the demographic groups most similar to Immigrants from England are Sri Lankan ($101,960, a difference of 0.060%), Assyrian/Chaldean/Syriac ($101,936, a difference of 0.080%), Macedonian ($101,882, a difference of 0.14%), Austrian ($101,842, a difference of 0.17%), and Immigrants from Kazakhstan ($101,727, a difference of 0.29%).
| Demographics | Rating | Rank | Householder Income Ages 25 - 44 years |
| Immigrants | Hungary | 98.9 /100 | #86 | Exceptional $102,655 |
| Immigrants | Western Europe | 98.9 /100 | #87 | Exceptional $102,654 |
| Immigrants | Canada | 98.9 /100 | #88 | Exceptional $102,616 |
| Romanians | 98.8 /100 | #89 | Exceptional $102,544 |
| Ukrainians | 98.8 /100 | #90 | Exceptional $102,451 |
| Croatians | 98.7 /100 | #91 | Exceptional $102,414 |
| Immigrants | North America | 98.7 /100 | #92 | Exceptional $102,407 |
| Immigrants | England | 98.4 /100 | #93 | Exceptional $102,020 |
| Sri Lankans | 98.4 /100 | #94 | Exceptional $101,960 |
| Assyrians/Chaldeans/Syriacs | 98.3 /100 | #95 | Exceptional $101,936 |
| Macedonians | 98.3 /100 | #96 | Exceptional $101,882 |
| Austrians | 98.3 /100 | #97 | Exceptional $101,842 |
| Immigrants | Kazakhstan | 98.1 /100 | #98 | Exceptional $101,727 |
| Taiwanese | 97.9 /100 | #99 | Exceptional $101,492 |
| Immigrants | Argentina | 97.8 /100 | #100 | Exceptional $101,415 |