Immigrants from Peru vs White/Caucasian Householder Income Ages 25 - 44 years
COMPARE
Immigrants from Peru
White/Caucasian
Householder Income Ages 25 - 44 years
Householder Income Ages 25 - 44 years Comparison
Immigrants from Peru
Whites/Caucasians
$97,329
HOUSEHOLDER INCOME AGES 25 - 44 YEARS
82.2/ 100
METRIC RATING
139th/ 347
METRIC RANK
$91,668
HOUSEHOLDER INCOME AGES 25 - 44 YEARS
16.7/ 100
METRIC RATING
200th/ 347
METRIC RANK
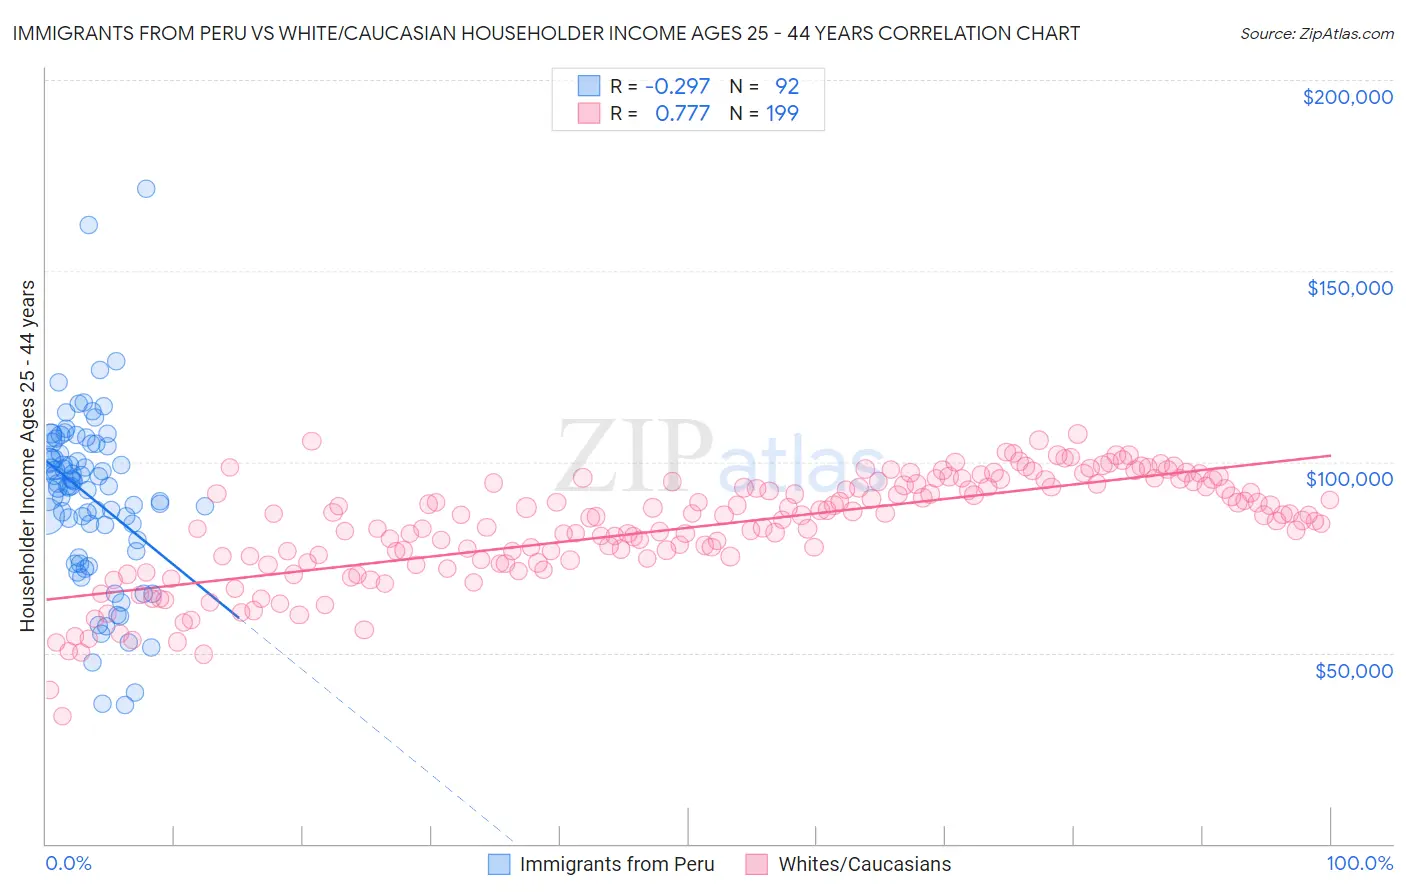
Immigrants from Peru vs White/Caucasian Householder Income Ages 25 - 44 years Correlation Chart
The statistical analysis conducted on geographies consisting of 328,285,431 people shows a weak negative correlation between the proportion of Immigrants from Peru and household income with householder between the ages 25 and 44 in the United States with a correlation coefficient (R) of -0.297 and weighted average of $97,329. Similarly, the statistical analysis conducted on geographies consisting of 574,090,694 people shows a strong positive correlation between the proportion of Whites/Caucasians and household income with householder between the ages 25 and 44 in the United States with a correlation coefficient (R) of 0.777 and weighted average of $91,668, a difference of 6.2%.
Householder Income Ages 25 - 44 years Correlation Summary
| Measurement | Immigrants from Peru | White/Caucasian |
| Minimum | $36,176 | $33,408 |
| Maximum | $171,373 | $107,218 |
| Range | $135,197 | $73,811 |
| Mean | $90,702 | $82,806 |
| Median | $93,723 | $86,008 |
| Interquartile 25% (IQ1) | $77,980 | $74,387 |
| Interquartile 75% (IQ3) | $104,309 | $94,127 |
| Interquartile Range (IQR) | $26,329 | $19,740 |
| Standard Deviation (Sample) | $22,743 | $14,065 |
| Standard Deviation (Population) | $22,619 | $14,029 |
Similar Demographics by Householder Income Ages 25 - 44 years
Demographics Similar to Immigrants from Peru by Householder Income Ages 25 - 44 years
In terms of householder income ages 25 - 44 years, the demographic groups most similar to Immigrants from Peru are Lebanese ($97,339, a difference of 0.010%), Arab ($97,336, a difference of 0.010%), Immigrants from Morocco ($97,305, a difference of 0.020%), Luxembourger ($97,237, a difference of 0.090%), and Danish ($97,221, a difference of 0.11%).
| Demographics | Rating | Rank | Householder Income Ages 25 - 44 years |
| Immigrants | Zimbabwe | 86.3 /100 | #132 | Excellent $97,880 |
| Tsimshian | 85.8 /100 | #133 | Excellent $97,809 |
| Canadians | 84.5 /100 | #134 | Excellent $97,625 |
| Immigrants | Oceania | 84.5 /100 | #135 | Excellent $97,623 |
| Hungarians | 83.9 /100 | #136 | Excellent $97,544 |
| Lebanese | 82.3 /100 | #137 | Excellent $97,339 |
| Arabs | 82.3 /100 | #138 | Excellent $97,336 |
| Immigrants | Peru | 82.2 /100 | #139 | Excellent $97,329 |
| Immigrants | Morocco | 82.0 /100 | #140 | Excellent $97,305 |
| Luxembourgers | 81.5 /100 | #141 | Excellent $97,237 |
| Danes | 81.3 /100 | #142 | Excellent $97,221 |
| Immigrants | Jordan | 81.0 /100 | #143 | Excellent $97,185 |
| Immigrants | Chile | 80.8 /100 | #144 | Excellent $97,159 |
| Norwegians | 78.2 /100 | #145 | Good $96,866 |
| Ethiopians | 77.8 /100 | #146 | Good $96,824 |
Demographics Similar to Whites/Caucasians by Householder Income Ages 25 - 44 years
In terms of householder income ages 25 - 44 years, the demographic groups most similar to Whites/Caucasians are Kenyan ($91,684, a difference of 0.020%), Japanese ($91,624, a difference of 0.050%), Ecuadorian ($91,574, a difference of 0.10%), Immigrants from Cambodia ($91,533, a difference of 0.15%), and Nepalese ($91,498, a difference of 0.19%).
| Demographics | Rating | Rank | Householder Income Ages 25 - 44 years |
| Samoans | 23.0 /100 | #193 | Fair $92,385 |
| Immigrants | Azores | 22.4 /100 | #194 | Fair $92,322 |
| Celtics | 21.6 /100 | #195 | Fair $92,241 |
| Immigrants | Colombia | 21.3 /100 | #196 | Fair $92,204 |
| Spanish | 21.2 /100 | #197 | Fair $92,200 |
| Vietnamese | 20.2 /100 | #198 | Fair $92,089 |
| Kenyans | 16.8 /100 | #199 | Poor $91,684 |
| Whites/Caucasians | 16.7 /100 | #200 | Poor $91,668 |
| Japanese | 16.4 /100 | #201 | Poor $91,624 |
| Ecuadorians | 16.0 /100 | #202 | Poor $91,574 |
| Immigrants | Cambodia | 15.7 /100 | #203 | Poor $91,533 |
| Nepalese | 15.4 /100 | #204 | Poor $91,498 |
| Immigrants | Eastern Africa | 15.2 /100 | #205 | Poor $91,458 |
| Aleuts | 14.5 /100 | #206 | Poor $91,370 |
| Yugoslavians | 14.5 /100 | #207 | Poor $91,368 |