Eastern European vs White/Caucasian Householder Income Ages 25 - 44 years
COMPARE
Eastern European
White/Caucasian
Householder Income Ages 25 - 44 years
Householder Income Ages 25 - 44 years Comparison
Eastern Europeans
Whites/Caucasians
$114,523
HOUSEHOLDER INCOME AGES 25 - 44 YEARS
100.0/ 100
METRIC RATING
18th/ 347
METRIC RANK
$91,668
HOUSEHOLDER INCOME AGES 25 - 44 YEARS
16.7/ 100
METRIC RATING
200th/ 347
METRIC RANK
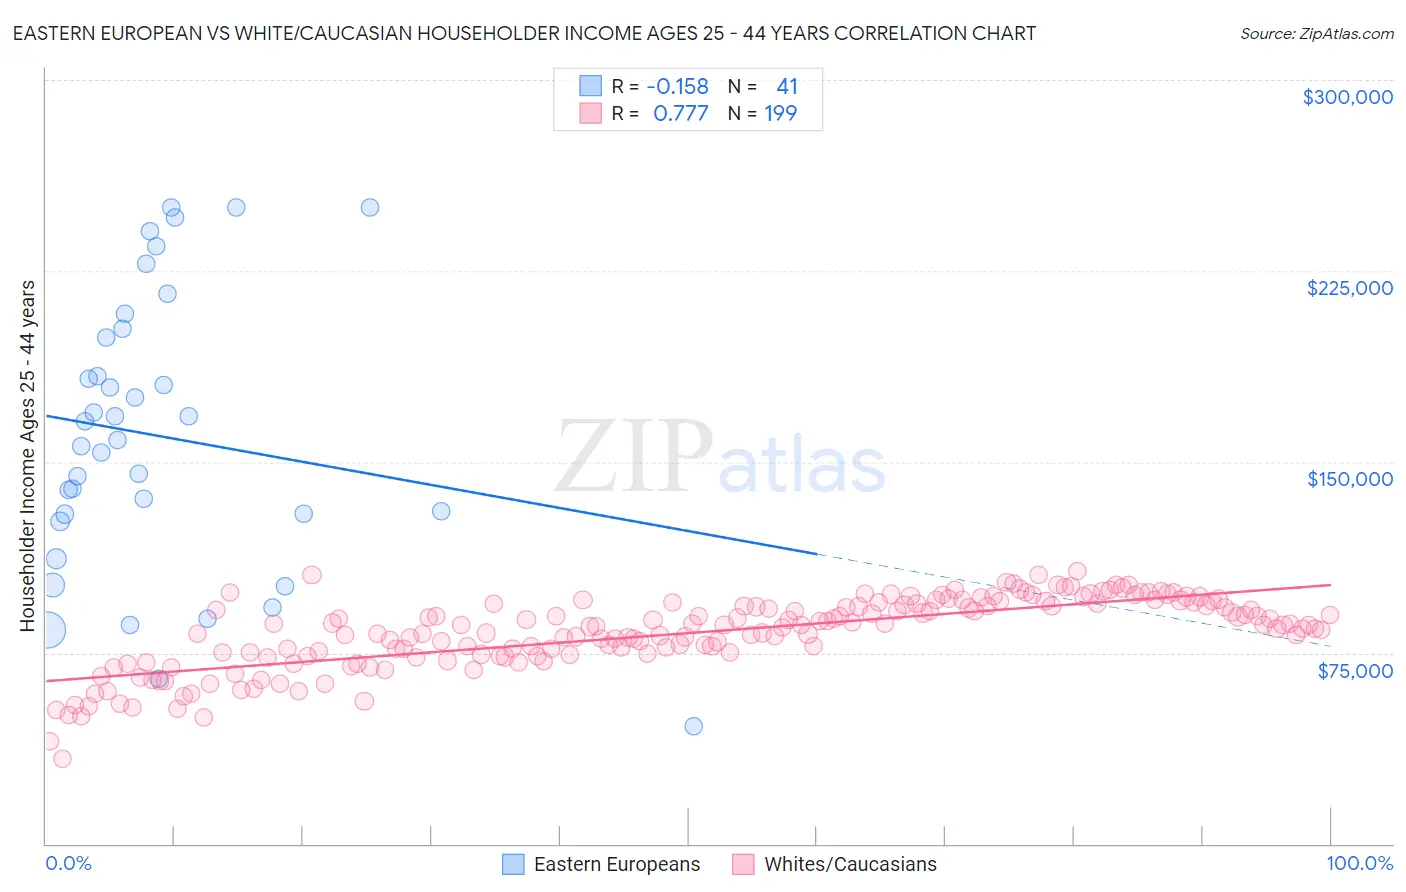
Eastern European vs White/Caucasian Householder Income Ages 25 - 44 years Correlation Chart
The statistical analysis conducted on geographies consisting of 459,307,576 people shows a poor negative correlation between the proportion of Eastern Europeans and household income with householder between the ages 25 and 44 in the United States with a correlation coefficient (R) of -0.158 and weighted average of $114,523. Similarly, the statistical analysis conducted on geographies consisting of 574,090,694 people shows a strong positive correlation between the proportion of Whites/Caucasians and household income with householder between the ages 25 and 44 in the United States with a correlation coefficient (R) of 0.777 and weighted average of $91,668, a difference of 24.9%.
Householder Income Ages 25 - 44 years Correlation Summary
| Measurement | Eastern European | White/Caucasian |
| Minimum | $46,280 | $33,408 |
| Maximum | $250,001 | $107,218 |
| Range | $203,721 | $73,811 |
| Mean | $160,039 | $82,806 |
| Median | $158,530 | $86,008 |
| Interquartile 25% (IQ1) | $128,065 | $74,387 |
| Interquartile 75% (IQ3) | $200,429 | $94,127 |
| Interquartile Range (IQR) | $72,364 | $19,740 |
| Standard Deviation (Sample) | $54,167 | $14,065 |
| Standard Deviation (Population) | $53,502 | $14,029 |
Similar Demographics by Householder Income Ages 25 - 44 years
Demographics Similar to Eastern Europeans by Householder Income Ages 25 - 44 years
In terms of householder income ages 25 - 44 years, the demographic groups most similar to Eastern Europeans are Burmese ($113,701, a difference of 0.72%), Immigrants from Korea ($113,401, a difference of 0.99%), Immigrants from Australia ($115,947, a difference of 1.2%), Cypriot ($116,364, a difference of 1.6%), and Asian ($112,666, a difference of 1.7%).
| Demographics | Rating | Rank | Householder Income Ages 25 - 44 years |
| Okinawans | 100.0 /100 | #11 | Exceptional $119,349 |
| Immigrants | Iran | 100.0 /100 | #12 | Exceptional $119,204 |
| Immigrants | Eastern Asia | 100.0 /100 | #13 | Exceptional $118,056 |
| Immigrants | Israel | 100.0 /100 | #14 | Exceptional $117,219 |
| Immigrants | South Central Asia | 100.0 /100 | #15 | Exceptional $116,626 |
| Cypriots | 100.0 /100 | #16 | Exceptional $116,364 |
| Immigrants | Australia | 100.0 /100 | #17 | Exceptional $115,947 |
| Eastern Europeans | 100.0 /100 | #18 | Exceptional $114,523 |
| Burmese | 100.0 /100 | #19 | Exceptional $113,701 |
| Immigrants | Korea | 100.0 /100 | #20 | Exceptional $113,401 |
| Asians | 100.0 /100 | #21 | Exceptional $112,666 |
| Immigrants | Belgium | 100.0 /100 | #22 | Exceptional $112,575 |
| Immigrants | Japan | 100.0 /100 | #23 | Exceptional $112,228 |
| Immigrants | Sweden | 100.0 /100 | #24 | Exceptional $112,010 |
| Immigrants | Northern Europe | 100.0 /100 | #25 | Exceptional $111,676 |
Demographics Similar to Whites/Caucasians by Householder Income Ages 25 - 44 years
In terms of householder income ages 25 - 44 years, the demographic groups most similar to Whites/Caucasians are Kenyan ($91,684, a difference of 0.020%), Japanese ($91,624, a difference of 0.050%), Ecuadorian ($91,574, a difference of 0.10%), Immigrants from Cambodia ($91,533, a difference of 0.15%), and Nepalese ($91,498, a difference of 0.19%).
| Demographics | Rating | Rank | Householder Income Ages 25 - 44 years |
| Samoans | 23.0 /100 | #193 | Fair $92,385 |
| Immigrants | Azores | 22.4 /100 | #194 | Fair $92,322 |
| Celtics | 21.6 /100 | #195 | Fair $92,241 |
| Immigrants | Colombia | 21.3 /100 | #196 | Fair $92,204 |
| Spanish | 21.2 /100 | #197 | Fair $92,200 |
| Vietnamese | 20.2 /100 | #198 | Fair $92,089 |
| Kenyans | 16.8 /100 | #199 | Poor $91,684 |
| Whites/Caucasians | 16.7 /100 | #200 | Poor $91,668 |
| Japanese | 16.4 /100 | #201 | Poor $91,624 |
| Ecuadorians | 16.0 /100 | #202 | Poor $91,574 |
| Immigrants | Cambodia | 15.7 /100 | #203 | Poor $91,533 |
| Nepalese | 15.4 /100 | #204 | Poor $91,498 |
| Immigrants | Eastern Africa | 15.2 /100 | #205 | Poor $91,458 |
| Aleuts | 14.5 /100 | #206 | Poor $91,370 |
| Yugoslavians | 14.5 /100 | #207 | Poor $91,368 |