Immigrants from Vietnam vs Mexican Householder Income Ages 45 - 64 years
COMPARE
Immigrants from Vietnam
Mexican
Householder Income Ages 45 - 64 years
Householder Income Ages 45 - 64 years Comparison
Immigrants from Vietnam
Mexicans
$106,417
HOUSEHOLDER INCOME AGES 45 - 64 YEARS
95.5/ 100
METRIC RATING
111th/ 347
METRIC RANK
$86,816
HOUSEHOLDER INCOME AGES 45 - 64 YEARS
0.1/ 100
METRIC RATING
283rd/ 347
METRIC RANK
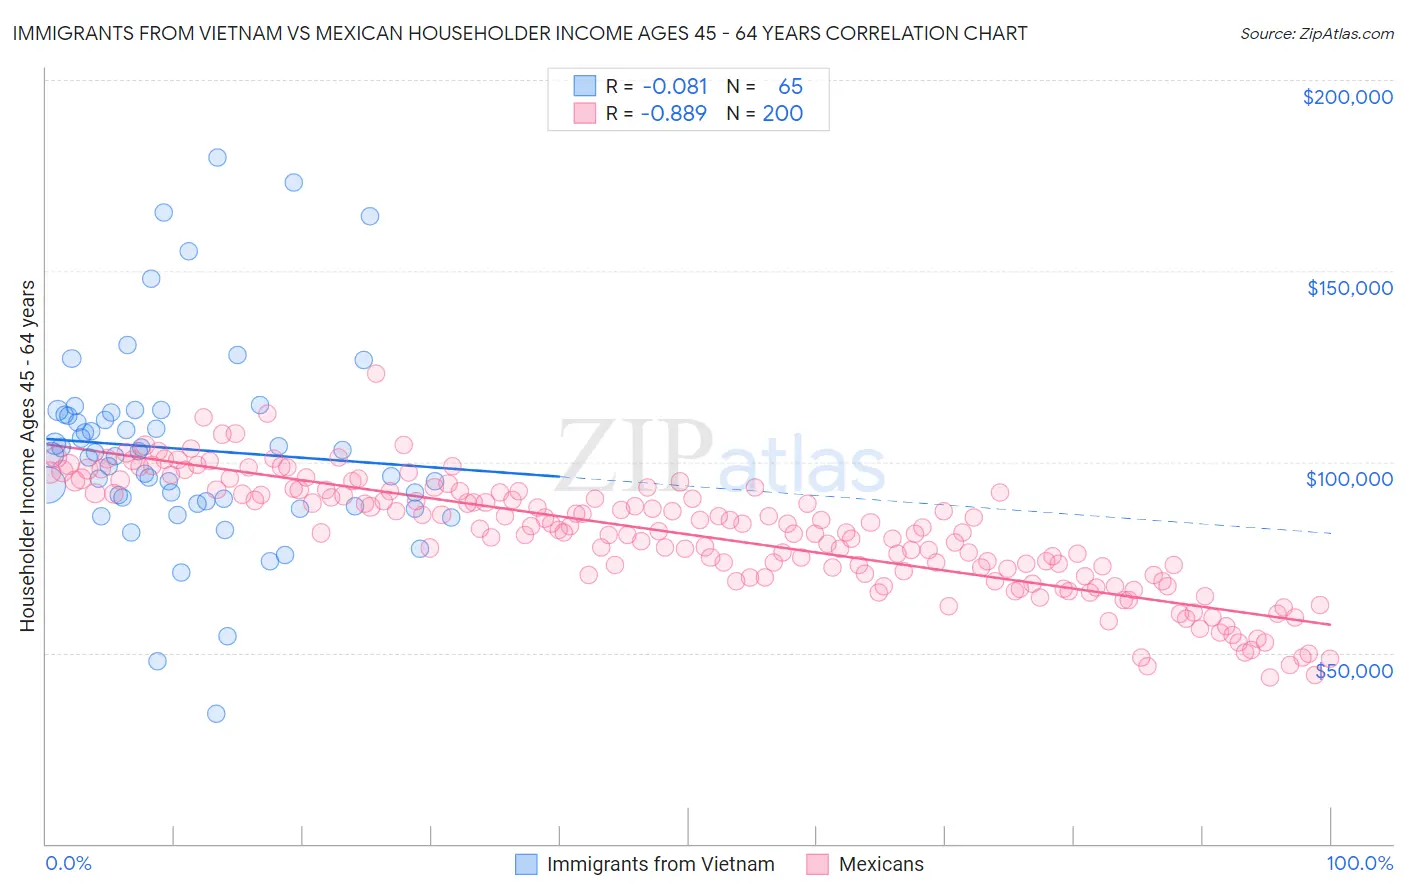
Immigrants from Vietnam vs Mexican Householder Income Ages 45 - 64 years Correlation Chart
The statistical analysis conducted on geographies consisting of 404,123,735 people shows a slight negative correlation between the proportion of Immigrants from Vietnam and household income with householder between the ages 45 and 64 in the United States with a correlation coefficient (R) of -0.081 and weighted average of $106,417. Similarly, the statistical analysis conducted on geographies consisting of 561,629,225 people shows a very strong negative correlation between the proportion of Mexicans and household income with householder between the ages 45 and 64 in the United States with a correlation coefficient (R) of -0.889 and weighted average of $86,816, a difference of 22.6%.
Householder Income Ages 45 - 64 years Correlation Summary
| Measurement | Immigrants from Vietnam | Mexican |
| Minimum | $34,079 | $43,450 |
| Maximum | $179,835 | $123,118 |
| Range | $145,756 | $79,668 |
| Mean | $103,333 | $80,968 |
| Median | $101,814 | $82,307 |
| Interquartile 25% (IQ1) | $89,317 | $70,470 |
| Interquartile 75% (IQ3) | $112,670 | $92,226 |
| Interquartile Range (IQR) | $23,353 | $21,757 |
| Standard Deviation (Sample) | $26,298 | $15,403 |
| Standard Deviation (Population) | $26,095 | $15,365 |
Similar Demographics by Householder Income Ages 45 - 64 years
Demographics Similar to Immigrants from Vietnam by Householder Income Ages 45 - 64 years
In terms of householder income ages 45 - 64 years, the demographic groups most similar to Immigrants from Vietnam are Swedish ($106,377, a difference of 0.040%), Immigrants from Brazil ($106,470, a difference of 0.050%), European ($106,367, a difference of 0.050%), Immigrants from Poland ($106,319, a difference of 0.090%), and Immigrants from Kuwait ($106,285, a difference of 0.13%).
| Demographics | Rating | Rank | Householder Income Ages 45 - 64 years |
| Immigrants | Ukraine | 96.7 /100 | #104 | Exceptional $107,079 |
| Macedonians | 96.7 /100 | #105 | Exceptional $107,074 |
| Armenians | 96.6 /100 | #106 | Exceptional $107,002 |
| Immigrants | Fiji | 96.5 /100 | #107 | Exceptional $106,952 |
| Zimbabweans | 96.3 /100 | #108 | Exceptional $106,849 |
| Chileans | 95.9 /100 | #109 | Exceptional $106,611 |
| Immigrants | Brazil | 95.6 /100 | #110 | Exceptional $106,470 |
| Immigrants | Vietnam | 95.5 /100 | #111 | Exceptional $106,417 |
| Swedes | 95.4 /100 | #112 | Exceptional $106,377 |
| Europeans | 95.4 /100 | #113 | Exceptional $106,367 |
| Immigrants | Poland | 95.3 /100 | #114 | Exceptional $106,319 |
| Immigrants | Kuwait | 95.2 /100 | #115 | Exceptional $106,285 |
| British | 95.2 /100 | #116 | Exceptional $106,264 |
| Albanians | 95.1 /100 | #117 | Exceptional $106,243 |
| Immigrants | Western Asia | 95.0 /100 | #118 | Exceptional $106,217 |
Demographics Similar to Mexicans by Householder Income Ages 45 - 64 years
In terms of householder income ages 45 - 64 years, the demographic groups most similar to Mexicans are Central American Indian ($86,764, a difference of 0.060%), Senegalese ($86,897, a difference of 0.090%), Yaqui ($86,914, a difference of 0.11%), Yakama ($86,992, a difference of 0.20%), and Immigrants from Somalia ($86,987, a difference of 0.20%).
| Demographics | Rating | Rank | Householder Income Ages 45 - 64 years |
| Immigrants | Latin America | 0.1 /100 | #276 | Tragic $87,219 |
| Cree | 0.1 /100 | #277 | Tragic $87,185 |
| Immigrants | Jamaica | 0.1 /100 | #278 | Tragic $87,035 |
| Yakama | 0.1 /100 | #279 | Tragic $86,992 |
| Immigrants | Somalia | 0.1 /100 | #280 | Tragic $86,987 |
| Yaqui | 0.1 /100 | #281 | Tragic $86,914 |
| Senegalese | 0.1 /100 | #282 | Tragic $86,897 |
| Mexicans | 0.1 /100 | #283 | Tragic $86,816 |
| Central American Indians | 0.1 /100 | #284 | Tragic $86,764 |
| Blackfeet | 0.1 /100 | #285 | Tragic $86,595 |
| Immigrants | Guatemala | 0.1 /100 | #286 | Tragic $86,573 |
| Bangladeshis | 0.1 /100 | #287 | Tragic $86,402 |
| Immigrants | St. Vincent and the Grenadines | 0.1 /100 | #288 | Tragic $86,394 |
| Cubans | 0.1 /100 | #289 | Tragic $86,301 |
| Cherokee | 0.1 /100 | #290 | Tragic $86,125 |