Ugandan vs Immigrants from Micronesia Householder Income Ages 45 - 64 years
COMPARE
Ugandan
Immigrants from Micronesia
Householder Income Ages 45 - 64 years
Householder Income Ages 45 - 64 years Comparison
Ugandans
Immigrants from Micronesia
$103,472
HOUSEHOLDER INCOME AGES 45 - 64 YEARS
82.9/ 100
METRIC RATING
145th/ 347
METRIC RANK
$87,864
HOUSEHOLDER INCOME AGES 45 - 64 YEARS
0.2/ 100
METRIC RATING
268th/ 347
METRIC RANK
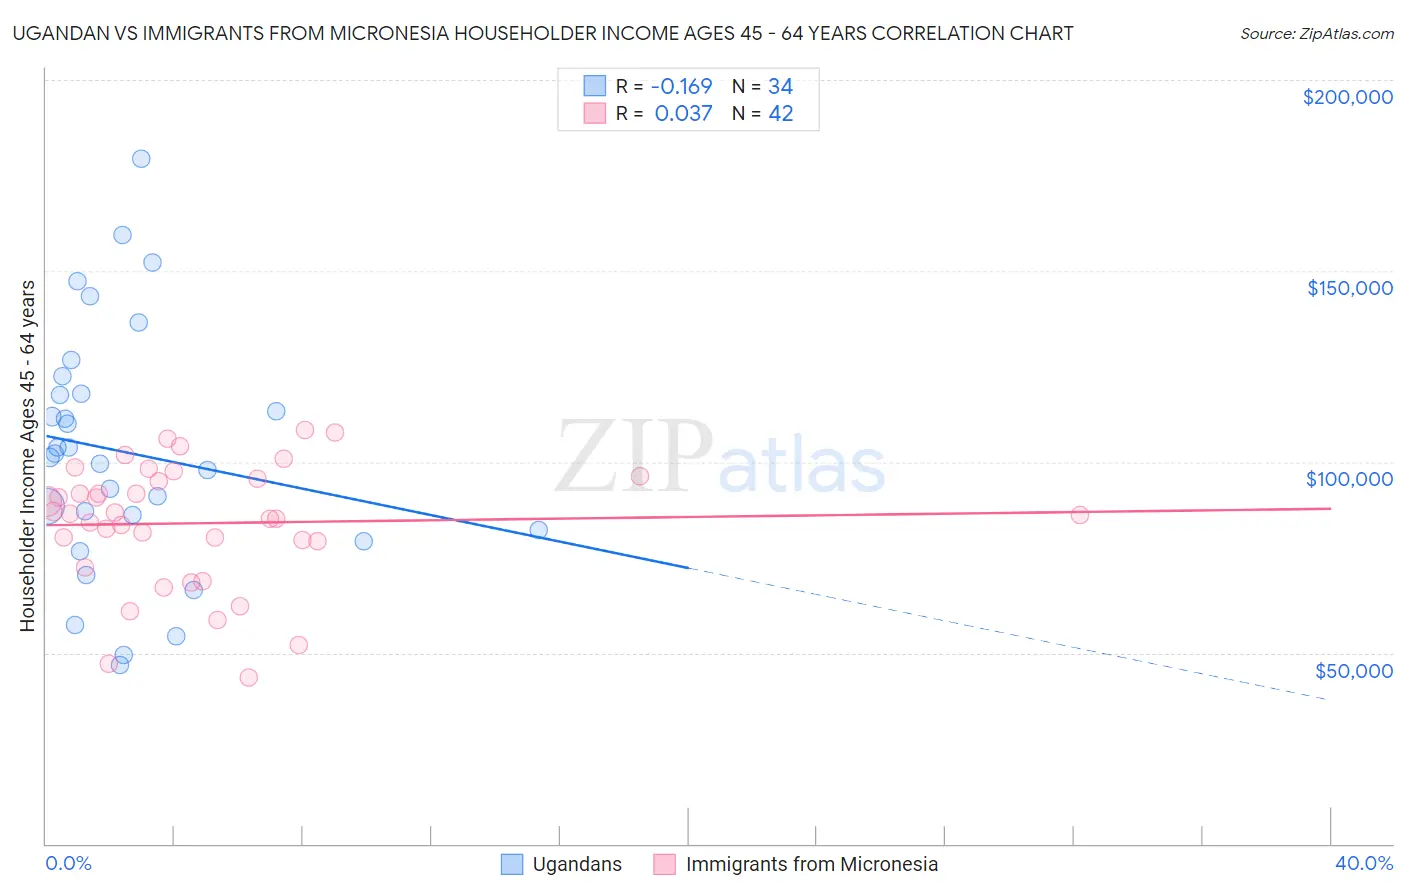
Ugandan vs Immigrants from Micronesia Householder Income Ages 45 - 64 years Correlation Chart
The statistical analysis conducted on geographies consisting of 93,977,582 people shows a poor negative correlation between the proportion of Ugandans and household income with householder between the ages 45 and 64 in the United States with a correlation coefficient (R) of -0.169 and weighted average of $103,472. Similarly, the statistical analysis conducted on geographies consisting of 61,565,628 people shows no correlation between the proportion of Immigrants from Micronesia and household income with householder between the ages 45 and 64 in the United States with a correlation coefficient (R) of 0.037 and weighted average of $87,864, a difference of 17.8%.
Householder Income Ages 45 - 64 years Correlation Summary
| Measurement | Ugandan | Immigrants from Micronesia |
| Minimum | $46,767 | $43,523 |
| Maximum | $179,310 | $108,482 |
| Range | $132,543 | $64,959 |
| Mean | $102,498 | $83,933 |
| Median | $101,686 | $86,276 |
| Interquartile 25% (IQ1) | $82,188 | $79,375 |
| Interquartile 75% (IQ3) | $117,857 | $95,598 |
| Interquartile Range (IQR) | $35,669 | $16,223 |
| Standard Deviation (Sample) | $31,832 | $16,111 |
| Standard Deviation (Population) | $31,360 | $15,918 |
Similar Demographics by Householder Income Ages 45 - 64 years
Demographics Similar to Ugandans by Householder Income Ages 45 - 64 years
In terms of householder income ages 45 - 64 years, the demographic groups most similar to Ugandans are Czech ($103,507, a difference of 0.030%), Serbian ($103,522, a difference of 0.050%), Luxembourger ($103,536, a difference of 0.060%), Immigrants from Chile ($103,412, a difference of 0.060%), and Basque ($103,387, a difference of 0.080%).
| Demographics | Rating | Rank | Householder Income Ages 45 - 64 years |
| Ethiopians | 84.7 /100 | #138 | Excellent $103,736 |
| Immigrants | Oceania | 84.5 /100 | #139 | Excellent $103,705 |
| Norwegians | 84.3 /100 | #140 | Excellent $103,682 |
| Immigrants | Uganda | 83.7 /100 | #141 | Excellent $103,584 |
| Luxembourgers | 83.3 /100 | #142 | Excellent $103,536 |
| Serbians | 83.2 /100 | #143 | Excellent $103,522 |
| Czechs | 83.1 /100 | #144 | Excellent $103,507 |
| Ugandans | 82.9 /100 | #145 | Excellent $103,472 |
| Immigrants | Chile | 82.5 /100 | #146 | Excellent $103,412 |
| Basques | 82.3 /100 | #147 | Excellent $103,387 |
| Immigrants | Germany | 81.5 /100 | #148 | Excellent $103,282 |
| Immigrants | Sierra Leone | 81.1 /100 | #149 | Excellent $103,227 |
| Immigrants | Peru | 80.7 /100 | #150 | Excellent $103,173 |
| Swiss | 79.9 /100 | #151 | Good $103,071 |
| Irish | 79.8 /100 | #152 | Good $103,067 |
Demographics Similar to Immigrants from Micronesia by Householder Income Ages 45 - 64 years
In terms of householder income ages 45 - 64 years, the demographic groups most similar to Immigrants from Micronesia are Spanish American ($87,836, a difference of 0.030%), Immigrants from Liberia ($87,739, a difference of 0.14%), Guatemalan ($87,705, a difference of 0.18%), Hmong ($88,115, a difference of 0.29%), and Cape Verdean ($87,580, a difference of 0.32%).
| Demographics | Rating | Rank | Householder Income Ages 45 - 64 years |
| Belizeans | 0.3 /100 | #261 | Tragic $88,684 |
| Somalis | 0.3 /100 | #262 | Tragic $88,600 |
| Immigrants | Senegal | 0.3 /100 | #263 | Tragic $88,421 |
| Osage | 0.3 /100 | #264 | Tragic $88,390 |
| Jamaicans | 0.2 /100 | #265 | Tragic $88,327 |
| Immigrants | West Indies | 0.2 /100 | #266 | Tragic $88,164 |
| Hmong | 0.2 /100 | #267 | Tragic $88,115 |
| Immigrants | Micronesia | 0.2 /100 | #268 | Tragic $87,864 |
| Spanish Americans | 0.2 /100 | #269 | Tragic $87,836 |
| Immigrants | Liberia | 0.2 /100 | #270 | Tragic $87,739 |
| Guatemalans | 0.2 /100 | #271 | Tragic $87,705 |
| Cape Verdeans | 0.2 /100 | #272 | Tragic $87,580 |
| Spanish American Indians | 0.2 /100 | #273 | Tragic $87,561 |
| Iroquois | 0.1 /100 | #274 | Tragic $87,255 |
| Immigrants | Belize | 0.1 /100 | #275 | Tragic $87,229 |