Filipino vs Okinawan Median Family Income
COMPARE
Filipino
Okinawan
Median Family Income
Median Family Income Comparison
Filipinos
Okinawans
$138,397
MEDIAN FAMILY INCOME
100.0/ 100
METRIC RATING
1st/ 347
METRIC RANK
$129,979
MEDIAN FAMILY INCOME
100.0/ 100
METRIC RATING
9th/ 347
METRIC RANK
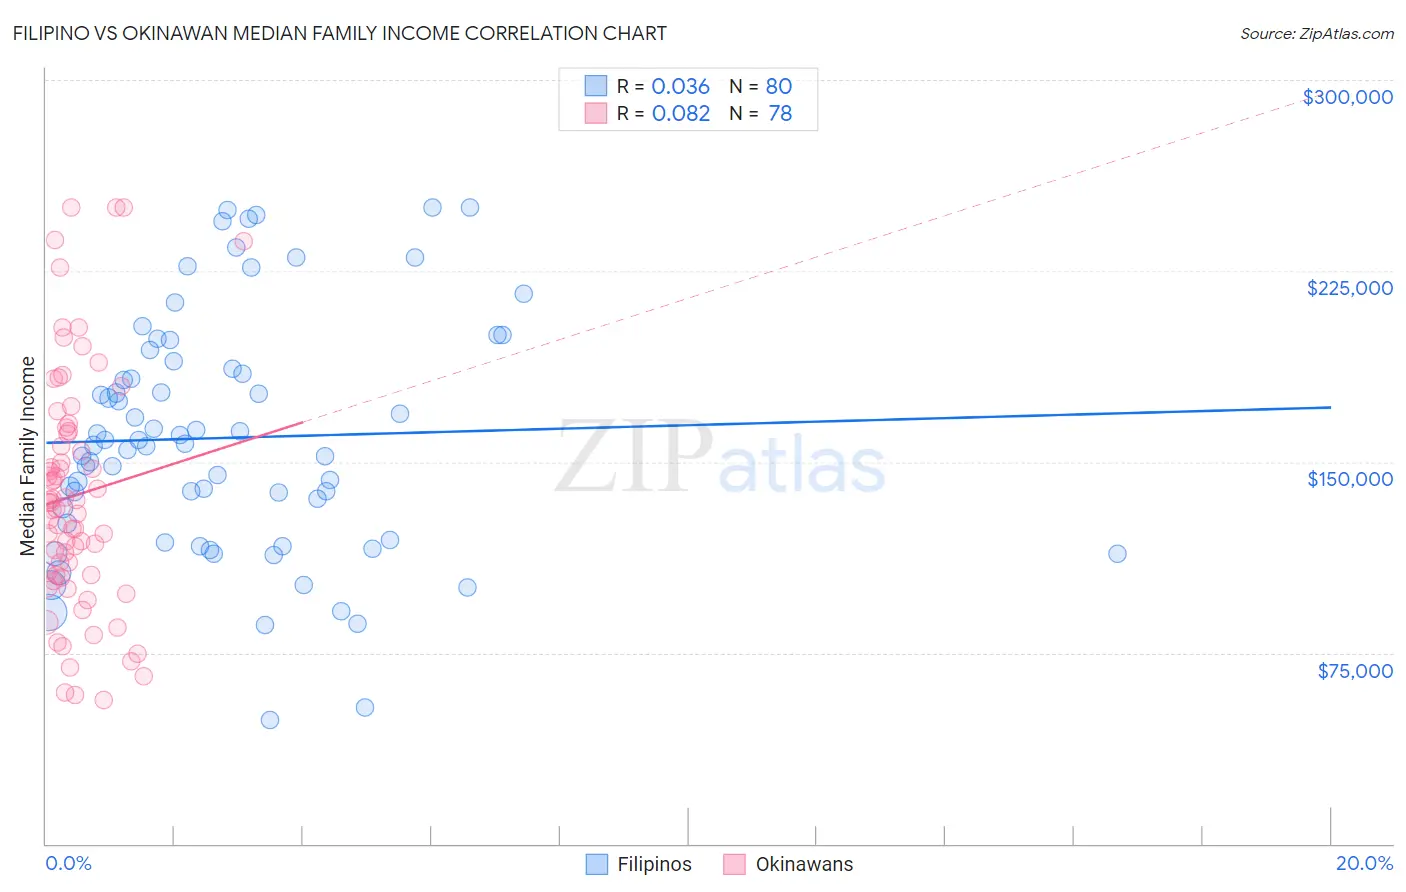
Filipino vs Okinawan Median Family Income Correlation Chart
The statistical analysis conducted on geographies consisting of 254,105,404 people shows no correlation between the proportion of Filipinos and median family income in the United States with a correlation coefficient (R) of 0.036 and weighted average of $138,397. Similarly, the statistical analysis conducted on geographies consisting of 73,711,216 people shows a slight positive correlation between the proportion of Okinawans and median family income in the United States with a correlation coefficient (R) of 0.082 and weighted average of $129,979, a difference of 6.5%.
Median Family Income Correlation Summary
| Measurement | Filipino | Okinawan |
| Minimum | $48,393 | $56,429 |
| Maximum | $250,001 | $250,001 |
| Range | $201,608 | $193,572 |
| Mean | $159,472 | $136,798 |
| Median | $156,854 | $132,761 |
| Interquartile 25% (IQ1) | $122,608 | $105,402 |
| Interquartile 75% (IQ3) | $188,025 | $161,875 |
| Interquartile Range (IQR) | $65,417 | $56,473 |
| Standard Deviation (Sample) | $46,927 | $46,889 |
| Standard Deviation (Population) | $46,633 | $46,587 |
Demographics Similar to Filipinos and Okinawans by Median Family Income
In terms of median family income, the demographic groups most similar to Filipinos are Immigrants from Taiwan ($136,949, a difference of 1.1%), Immigrants from Singapore ($134,818, a difference of 2.6%), Immigrants from India ($134,028, a difference of 3.3%), Iranian ($133,839, a difference of 3.4%), and Thai ($131,281, a difference of 5.4%). Similarly, the demographic groups most similar to Okinawans are Immigrants from Iran ($130,894, a difference of 0.70%), Immigrants from Hong Kong ($131,067, a difference of 0.84%), Thai ($131,281, a difference of 1.0%), Immigrants from Ireland ($127,584, a difference of 1.9%), and Immigrants from Israel ($127,430, a difference of 2.0%).
| Demographics | Rating | Rank | Median Family Income |
| Filipinos | 100.0 /100 | #1 | Exceptional $138,397 |
| Immigrants | Taiwan | 100.0 /100 | #2 | Exceptional $136,949 |
| Immigrants | Singapore | 100.0 /100 | #3 | Exceptional $134,818 |
| Immigrants | India | 100.0 /100 | #4 | Exceptional $134,028 |
| Iranians | 100.0 /100 | #5 | Exceptional $133,839 |
| Thais | 100.0 /100 | #6 | Exceptional $131,281 |
| Immigrants | Hong Kong | 100.0 /100 | #7 | Exceptional $131,067 |
| Immigrants | Iran | 100.0 /100 | #8 | Exceptional $130,894 |
| Okinawans | 100.0 /100 | #9 | Exceptional $129,979 |
| Immigrants | Ireland | 100.0 /100 | #10 | Exceptional $127,584 |
| Immigrants | Israel | 100.0 /100 | #11 | Exceptional $127,430 |
| Cypriots | 100.0 /100 | #12 | Exceptional $127,064 |
| Immigrants | Australia | 100.0 /100 | #13 | Exceptional $126,620 |
| Immigrants | South Central Asia | 100.0 /100 | #14 | Exceptional $125,956 |
| Eastern Europeans | 100.0 /100 | #15 | Exceptional $125,546 |
| Immigrants | China | 100.0 /100 | #16 | Exceptional $125,540 |
| Indians (Asian) | 100.0 /100 | #17 | Exceptional $125,312 |
| Immigrants | Eastern Asia | 100.0 /100 | #18 | Exceptional $125,150 |
| Immigrants | Belgium | 100.0 /100 | #19 | Exceptional $123,831 |
| Burmese | 100.0 /100 | #20 | Exceptional $123,369 |