Macedonian vs Canadian Median Male Earnings
COMPARE
Macedonian
Canadian
Median Male Earnings
Median Male Earnings Comparison
Macedonians
Canadians
$59,522
MEDIAN MALE EARNINGS
99.3/ 100
METRIC RATING
87th/ 347
METRIC RANK
$57,286
MEDIAN MALE EARNINGS
93.9/ 100
METRIC RATING
120th/ 347
METRIC RANK
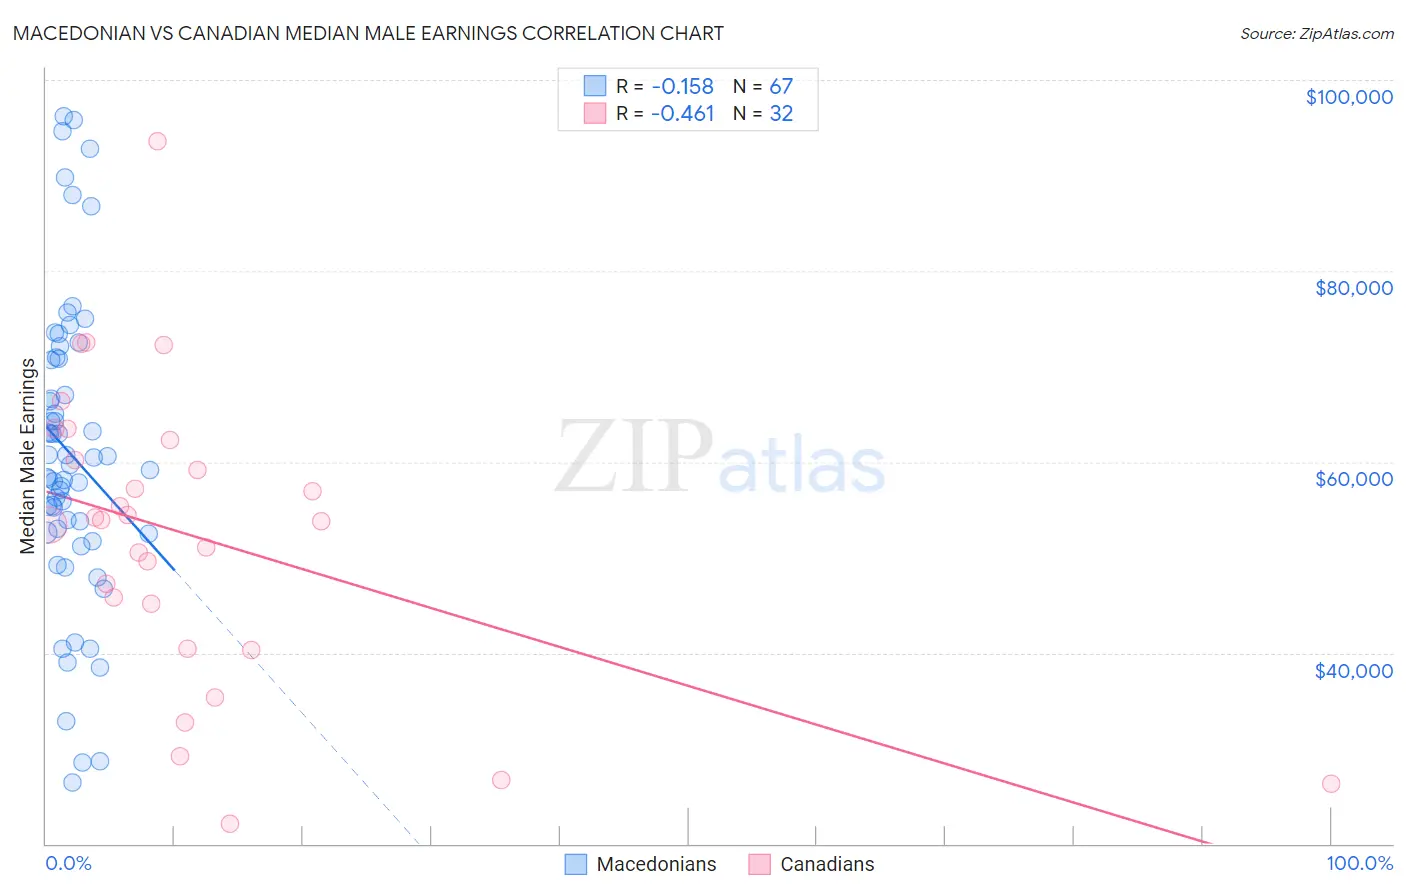
Macedonian vs Canadian Median Male Earnings Correlation Chart
The statistical analysis conducted on geographies consisting of 132,576,101 people shows a poor negative correlation between the proportion of Macedonians and median male earnings in the United States with a correlation coefficient (R) of -0.158 and weighted average of $59,522. Similarly, the statistical analysis conducted on geographies consisting of 437,343,758 people shows a moderate negative correlation between the proportion of Canadians and median male earnings in the United States with a correlation coefficient (R) of -0.461 and weighted average of $57,286, a difference of 3.9%.
Median Male Earnings Correlation Summary
| Measurement | Macedonian | Canadian |
| Minimum | $26,375 | $22,125 |
| Maximum | $96,230 | $93,638 |
| Range | $69,855 | $71,513 |
| Mean | $60,888 | $52,093 |
| Median | $59,610 | $53,822 |
| Interquartile 25% (IQ1) | $52,559 | $42,789 |
| Interquartile 75% (IQ3) | $70,744 | $61,239 |
| Interquartile Range (IQR) | $18,185 | $18,449 |
| Standard Deviation (Sample) | $15,733 | $15,572 |
| Standard Deviation (Population) | $15,615 | $15,327 |
Similar Demographics by Median Male Earnings
Demographics Similar to Macedonians by Median Male Earnings
In terms of median male earnings, the demographic groups most similar to Macedonians are Immigrants from England ($59,527, a difference of 0.010%), Afghan ($59,554, a difference of 0.050%), Italian ($59,551, a difference of 0.050%), Immigrants from Argentina ($59,491, a difference of 0.050%), and Immigrants from Moldova ($59,417, a difference of 0.18%).
| Demographics | Rating | Rank | Median Male Earnings |
| Immigrants | Hungary | 99.5 /100 | #80 | Exceptional $59,806 |
| Ukrainians | 99.4 /100 | #81 | Exceptional $59,728 |
| Croatians | 99.4 /100 | #82 | Exceptional $59,715 |
| Immigrants | Italy | 99.4 /100 | #83 | Exceptional $59,691 |
| Afghans | 99.3 /100 | #84 | Exceptional $59,554 |
| Italians | 99.3 /100 | #85 | Exceptional $59,551 |
| Immigrants | England | 99.3 /100 | #86 | Exceptional $59,527 |
| Macedonians | 99.3 /100 | #87 | Exceptional $59,522 |
| Immigrants | Argentina | 99.3 /100 | #88 | Exceptional $59,491 |
| Immigrants | Moldova | 99.2 /100 | #89 | Exceptional $59,417 |
| Austrians | 99.2 /100 | #90 | Exceptional $59,359 |
| Laotians | 99.2 /100 | #91 | Exceptional $59,351 |
| Immigrants | Kazakhstan | 99.1 /100 | #92 | Exceptional $59,278 |
| Immigrants | Southern Europe | 99.0 /100 | #93 | Exceptional $59,217 |
| Immigrants | North Macedonia | 99.0 /100 | #94 | Exceptional $59,189 |
Demographics Similar to Canadians by Median Male Earnings
In terms of median male earnings, the demographic groups most similar to Canadians are Arab ($57,298, a difference of 0.020%), Hungarian ($57,309, a difference of 0.040%), Immigrants from Zimbabwe ($57,352, a difference of 0.12%), Immigrants from Albania ($57,179, a difference of 0.19%), and Lebanese ($57,409, a difference of 0.22%).
| Demographics | Rating | Rank | Median Male Earnings |
| Carpatho Rusyns | 95.3 /100 | #113 | Exceptional $57,572 |
| Immigrants | Kuwait | 95.3 /100 | #114 | Exceptional $57,562 |
| Swedes | 94.8 /100 | #115 | Exceptional $57,445 |
| Lebanese | 94.6 /100 | #116 | Exceptional $57,409 |
| Immigrants | Zimbabwe | 94.3 /100 | #117 | Exceptional $57,352 |
| Hungarians | 94.0 /100 | #118 | Exceptional $57,309 |
| Arabs | 94.0 /100 | #119 | Exceptional $57,298 |
| Canadians | 93.9 /100 | #120 | Exceptional $57,286 |
| Immigrants | Albania | 93.3 /100 | #121 | Exceptional $57,179 |
| Immigrants | Jordan | 93.1 /100 | #122 | Exceptional $57,145 |
| Slovenes | 93.1 /100 | #123 | Exceptional $57,145 |
| Chileans | 91.9 /100 | #124 | Exceptional $56,973 |
| Immigrants | Morocco | 91.8 /100 | #125 | Exceptional $56,958 |
| Chinese | 91.1 /100 | #126 | Exceptional $56,872 |
| Brazilians | 90.9 /100 | #127 | Exceptional $56,837 |