Estonian vs Immigrants from Honduras Unemployment Among Women with Children Under 6 years
COMPARE
Estonian
Immigrants from Honduras
Unemployment Among Women with Children Under 6 years
Unemployment Among Women with Children Under 6 years Comparison
Estonians
Immigrants from Honduras
7.1%
UNEMPLOYMENT AMONG WOMEN WITH CHILDREN UNDER 6 YEARS
99.0/ 100
METRIC RATING
76th/ 347
METRIC RANK
8.4%
UNEMPLOYMENT AMONG WOMEN WITH CHILDREN UNDER 6 YEARS
0.3/ 100
METRIC RATING
266th/ 347
METRIC RANK
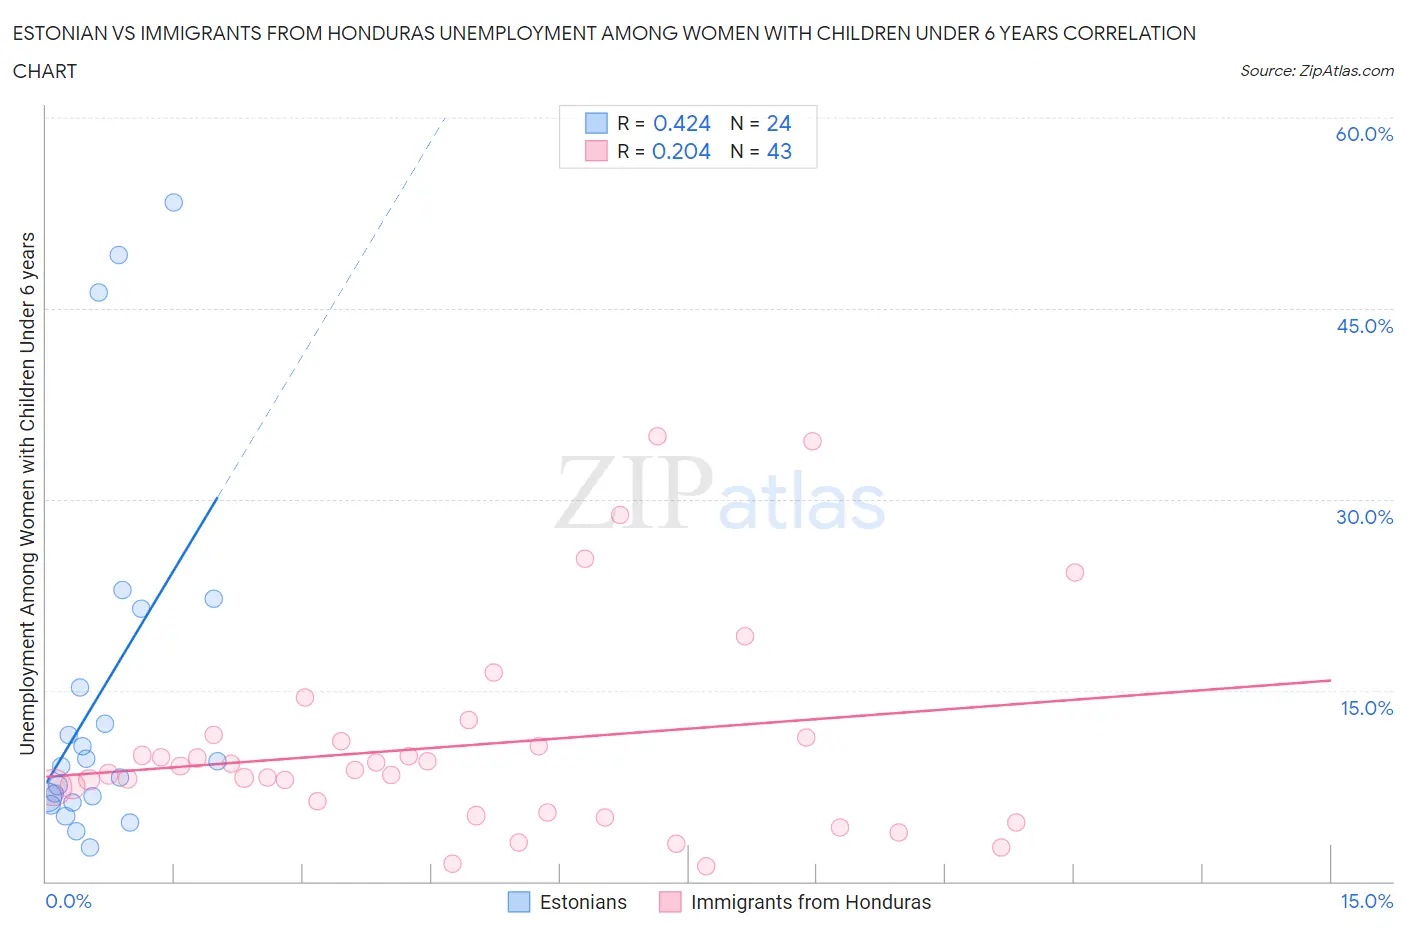
Estonian vs Immigrants from Honduras Unemployment Among Women with Children Under 6 years Correlation Chart
The statistical analysis conducted on geographies consisting of 107,788,240 people shows a moderate positive correlation between the proportion of Estonians and unemployment rate among women with children under the age of 6 in the United States with a correlation coefficient (R) of 0.424 and weighted average of 7.1%. Similarly, the statistical analysis conducted on geographies consisting of 261,485,985 people shows a weak positive correlation between the proportion of Immigrants from Honduras and unemployment rate among women with children under the age of 6 in the United States with a correlation coefficient (R) of 0.204 and weighted average of 8.4%, a difference of 18.8%.
Unemployment Among Women with Children Under 6 years Correlation Summary
| Measurement | Estonian | Immigrants from Honduras |
| Minimum | 2.7% | 1.2% |
| Maximum | 53.3% | 35.0% |
| Range | 50.6% | 33.8% |
| Mean | 14.9% | 10.6% |
| Median | 9.2% | 8.8% |
| Interquartile 25% (IQ1) | 6.4% | 5.4% |
| Interquartile 75% (IQ3) | 18.3% | 11.3% |
| Interquartile Range (IQR) | 11.9% | 5.9% |
| Standard Deviation (Sample) | 14.5% | 8.0% |
| Standard Deviation (Population) | 14.2% | 7.9% |
Similar Demographics by Unemployment Among Women with Children Under 6 years
Demographics Similar to Estonians by Unemployment Among Women with Children Under 6 years
In terms of unemployment among women with children under 6 years, the demographic groups most similar to Estonians are Immigrants from Croatia (7.1%, a difference of 0.030%), Immigrants from Eastern Europe (7.1%, a difference of 0.050%), Immigrants from Somalia (7.1%, a difference of 0.070%), Immigrants from Fiji (7.1%, a difference of 0.12%), and Immigrants from Greece (7.1%, a difference of 0.15%).
| Demographics | Rating | Rank | Unemployment Among Women with Children Under 6 years |
| Immigrants | Eritrea | 99.4 /100 | #69 | Exceptional 7.0% |
| Immigrants | Iraq | 99.4 /100 | #70 | Exceptional 7.0% |
| Afghans | 99.4 /100 | #71 | Exceptional 7.0% |
| Cubans | 99.4 /100 | #72 | Exceptional 7.0% |
| Immigrants | Czechoslovakia | 99.2 /100 | #73 | Exceptional 7.0% |
| Turks | 99.2 /100 | #74 | Exceptional 7.0% |
| Immigrants | Eastern Europe | 99.0 /100 | #75 | Exceptional 7.1% |
| Estonians | 99.0 /100 | #76 | Exceptional 7.1% |
| Immigrants | Croatia | 98.9 /100 | #77 | Exceptional 7.1% |
| Immigrants | Somalia | 98.9 /100 | #78 | Exceptional 7.1% |
| Immigrants | Fiji | 98.9 /100 | #79 | Exceptional 7.1% |
| Immigrants | Greece | 98.9 /100 | #80 | Exceptional 7.1% |
| Immigrants | Venezuela | 98.8 /100 | #81 | Exceptional 7.1% |
| Immigrants | Afghanistan | 98.7 /100 | #82 | Exceptional 7.1% |
| Egyptians | 98.7 /100 | #83 | Exceptional 7.1% |
Demographics Similar to Immigrants from Honduras by Unemployment Among Women with Children Under 6 years
In terms of unemployment among women with children under 6 years, the demographic groups most similar to Immigrants from Honduras are French Canadian (8.4%, a difference of 0.0%), Honduran (8.4%, a difference of 0.050%), Scotch-Irish (8.4%, a difference of 0.070%), West Indian (8.4%, a difference of 0.11%), and Immigrants from Liberia (8.4%, a difference of 0.12%).
| Demographics | Rating | Rank | Unemployment Among Women with Children Under 6 years |
| Barbadians | 0.4 /100 | #259 | Tragic 8.3% |
| Whites/Caucasians | 0.3 /100 | #260 | Tragic 8.4% |
| Immigrants | Liberia | 0.3 /100 | #261 | Tragic 8.4% |
| West Indians | 0.3 /100 | #262 | Tragic 8.4% |
| Scotch-Irish | 0.3 /100 | #263 | Tragic 8.4% |
| Hondurans | 0.3 /100 | #264 | Tragic 8.4% |
| French Canadians | 0.3 /100 | #265 | Tragic 8.4% |
| Immigrants | Honduras | 0.3 /100 | #266 | Tragic 8.4% |
| Belizeans | 0.2 /100 | #267 | Tragic 8.4% |
| Sub-Saharan Africans | 0.2 /100 | #268 | Tragic 8.4% |
| Immigrants | Haiti | 0.2 /100 | #269 | Tragic 8.4% |
| Immigrants | Senegal | 0.2 /100 | #270 | Tragic 8.5% |
| Immigrants | Congo | 0.2 /100 | #271 | Tragic 8.5% |
| Mexican American Indians | 0.1 /100 | #272 | Tragic 8.5% |
| Slovaks | 0.1 /100 | #273 | Tragic 8.5% |