English vs Egyptian Householder Income Over 65 years
COMPARE
English
Egyptian
Householder Income Over 65 years
Householder Income Over 65 years Comparison
English
Egyptians
$61,487
HOUSEHOLDER INCOME OVER 65 YEARS
63.3/ 100
METRIC RATING
158th/ 347
METRIC RANK
$65,441
HOUSEHOLDER INCOME OVER 65 YEARS
99.1/ 100
METRIC RATING
68th/ 347
METRIC RANK
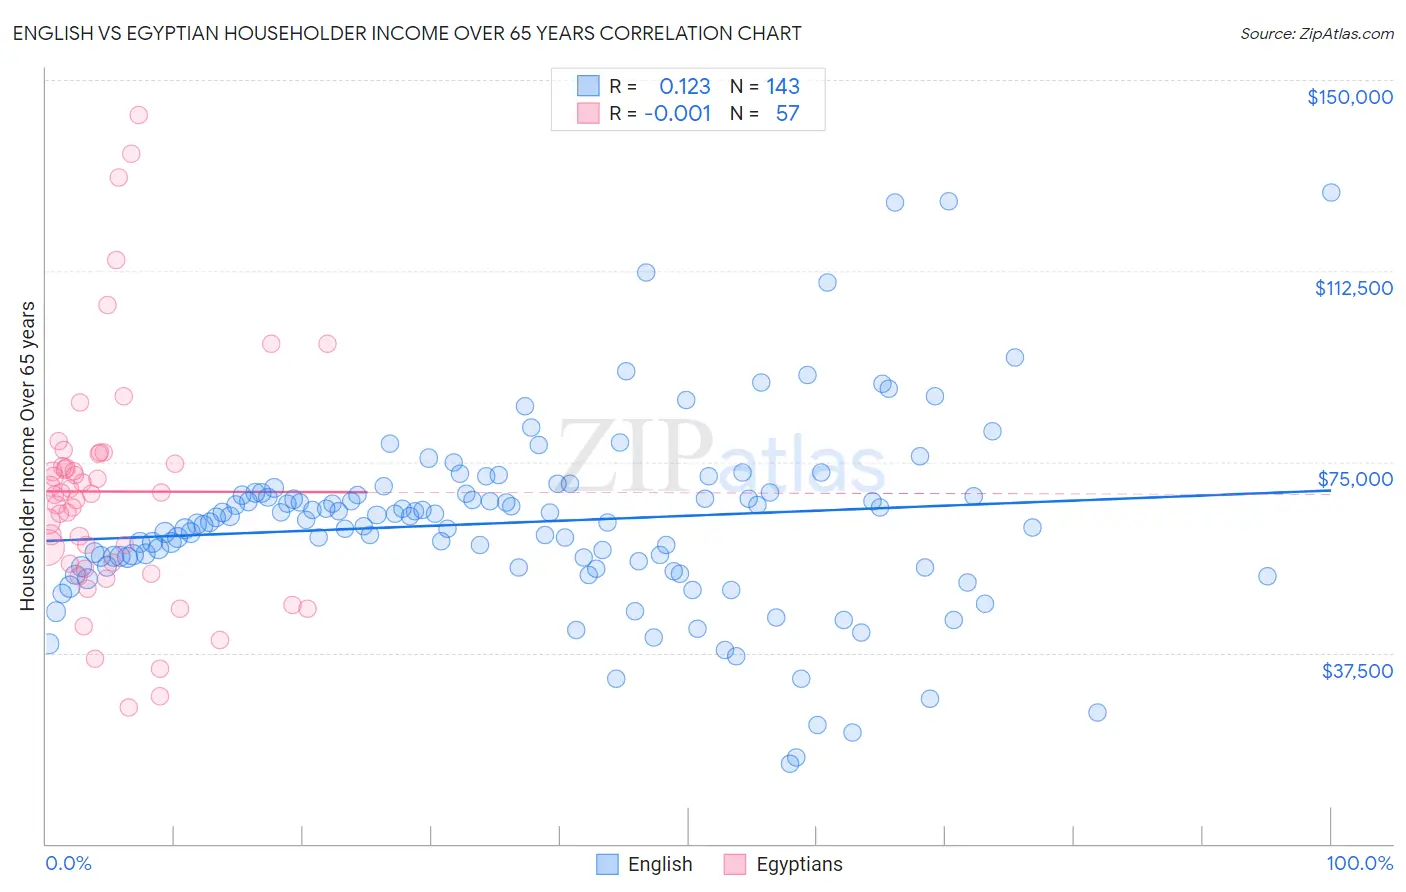
English vs Egyptian Householder Income Over 65 years Correlation Chart
The statistical analysis conducted on geographies consisting of 573,164,931 people shows a poor positive correlation between the proportion of English and household income with householder over the age of 65 in the United States with a correlation coefficient (R) of 0.123 and weighted average of $61,487. Similarly, the statistical analysis conducted on geographies consisting of 276,339,111 people shows no correlation between the proportion of Egyptians and household income with householder over the age of 65 in the United States with a correlation coefficient (R) of -0.001 and weighted average of $65,441, a difference of 6.4%.
Householder Income Over 65 years Correlation Summary
| Measurement | English | Egyptian |
| Minimum | $15,670 | $26,875 |
| Maximum | $127,891 | $143,025 |
| Range | $112,221 | $116,150 |
| Mean | $63,109 | $69,171 |
| Median | $63,519 | $68,843 |
| Interquartile 25% (IQ1) | $54,458 | $54,582 |
| Interquartile 75% (IQ3) | $68,838 | $75,582 |
| Interquartile Range (IQR) | $14,380 | $20,999 |
| Standard Deviation (Sample) | $18,180 | $23,561 |
| Standard Deviation (Population) | $18,116 | $23,353 |
Similar Demographics by Householder Income Over 65 years
Demographics Similar to English by Householder Income Over 65 years
In terms of householder income over 65 years, the demographic groups most similar to English are Brazilian ($61,465, a difference of 0.040%), Portuguese ($61,440, a difference of 0.080%), Macedonian ($61,564, a difference of 0.13%), Scandinavian ($61,586, a difference of 0.16%), and Polish ($61,598, a difference of 0.18%).
| Demographics | Rating | Rank | Householder Income Over 65 years |
| Hungarians | 67.7 /100 | #151 | Good $61,673 |
| Armenians | 67.3 /100 | #152 | Good $61,656 |
| Costa Ricans | 66.9 /100 | #153 | Good $61,638 |
| Swiss | 66.5 /100 | #154 | Good $61,621 |
| Poles | 65.9 /100 | #155 | Good $61,598 |
| Scandinavians | 65.6 /100 | #156 | Good $61,586 |
| Macedonians | 65.1 /100 | #157 | Good $61,564 |
| English | 63.3 /100 | #158 | Good $61,487 |
| Brazilians | 62.7 /100 | #159 | Good $61,465 |
| Portuguese | 62.1 /100 | #160 | Good $61,440 |
| Icelanders | 57.9 /100 | #161 | Average $61,270 |
| Czechs | 57.2 /100 | #162 | Average $61,244 |
| Ugandans | 55.5 /100 | #163 | Average $61,177 |
| Immigrants | North Macedonia | 55.4 /100 | #164 | Average $61,175 |
| Immigrants | Ukraine | 55.1 /100 | #165 | Average $61,163 |
Demographics Similar to Egyptians by Householder Income Over 65 years
In terms of householder income over 65 years, the demographic groups most similar to Egyptians are Samoan ($65,427, a difference of 0.020%), Immigrants from Malaysia ($65,497, a difference of 0.090%), Mongolian ($65,326, a difference of 0.18%), Greek ($65,306, a difference of 0.21%), and Argentinean ($65,246, a difference of 0.30%).
| Demographics | Rating | Rank | Householder Income Over 65 years |
| Maltese | 99.5 /100 | #61 | Exceptional $66,027 |
| Immigrants | Sierra Leone | 99.5 /100 | #62 | Exceptional $66,009 |
| Marshallese | 99.4 /100 | #63 | Exceptional $65,874 |
| Zimbabweans | 99.4 /100 | #64 | Exceptional $65,854 |
| Immigrants | England | 99.3 /100 | #65 | Exceptional $65,715 |
| South Africans | 99.3 /100 | #66 | Exceptional $65,652 |
| Immigrants | Malaysia | 99.1 /100 | #67 | Exceptional $65,497 |
| Egyptians | 99.1 /100 | #68 | Exceptional $65,441 |
| Samoans | 99.1 /100 | #69 | Exceptional $65,427 |
| Mongolians | 99.0 /100 | #70 | Exceptional $65,326 |
| Greeks | 98.9 /100 | #71 | Exceptional $65,306 |
| Argentineans | 98.9 /100 | #72 | Exceptional $65,246 |
| Immigrants | Ethiopia | 98.9 /100 | #73 | Exceptional $65,238 |
| Lithuanians | 98.8 /100 | #74 | Exceptional $65,209 |
| Sierra Leoneans | 98.6 /100 | #75 | Exceptional $65,038 |