English vs Taiwanese Disability Age 18 to 34
COMPARE
English
Taiwanese
Disability Age 18 to 34
Disability Age 18 to 34 Comparison
English
Taiwanese
7.8%
DISABILITY AGE 18 TO 34
0.0/ 100
METRIC RATING
306th/ 347
METRIC RANK
6.0%
DISABILITY AGE 18 TO 34
99.6/ 100
METRIC RATING
64th/ 347
METRIC RANK
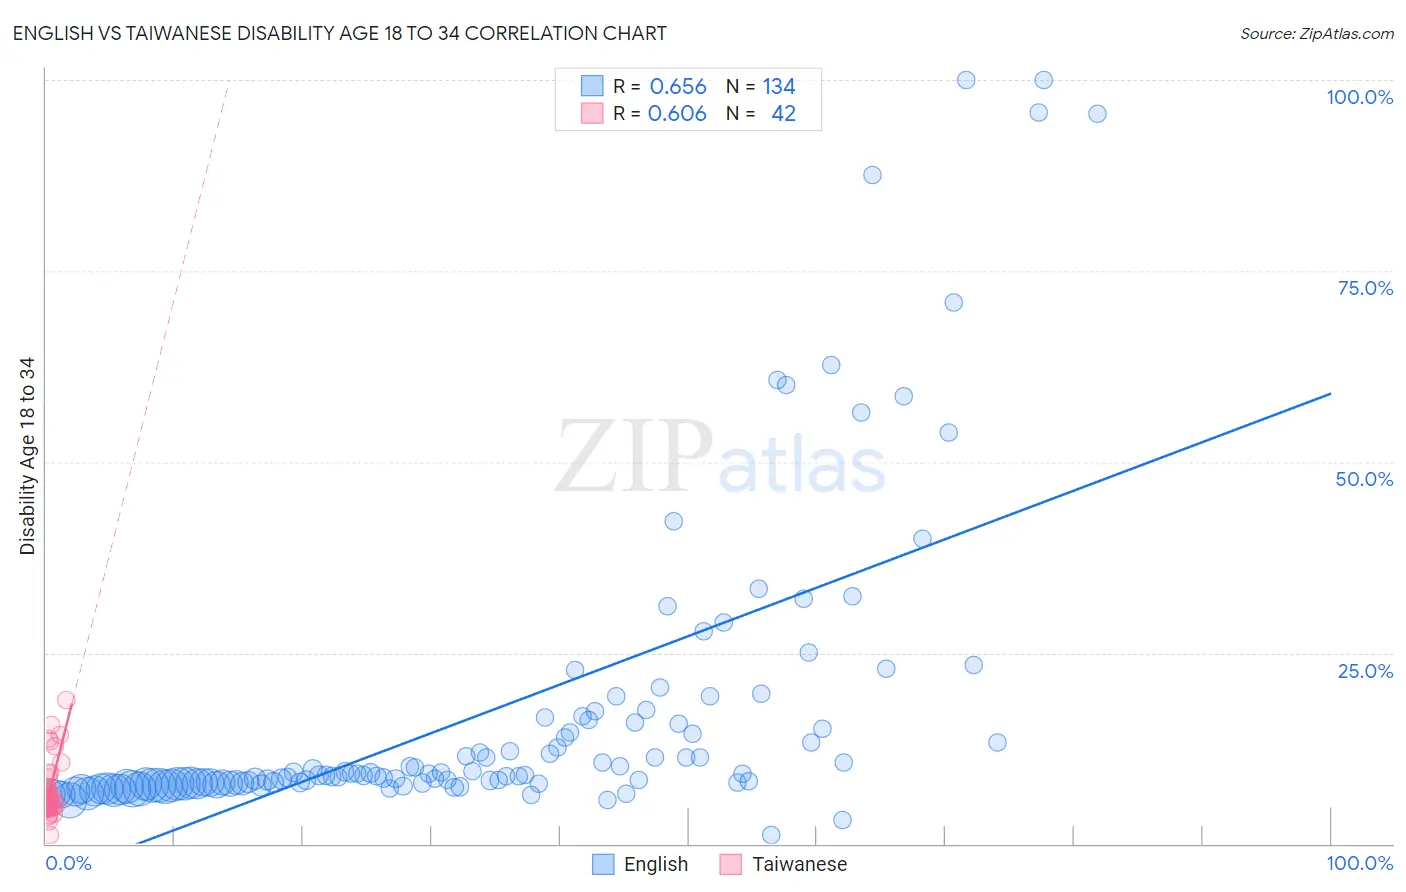
English vs Taiwanese Disability Age 18 to 34 Correlation Chart
The statistical analysis conducted on geographies consisting of 572,044,517 people shows a significant positive correlation between the proportion of English and percentage of population with a disability between the ages 18 and 35 in the United States with a correlation coefficient (R) of 0.656 and weighted average of 7.8%. Similarly, the statistical analysis conducted on geographies consisting of 31,720,747 people shows a significant positive correlation between the proportion of Taiwanese and percentage of population with a disability between the ages 18 and 35 in the United States with a correlation coefficient (R) of 0.606 and weighted average of 6.0%, a difference of 30.3%.
Disability Age 18 to 34 Correlation Summary
| Measurement | English | Taiwanese |
| Minimum | 1.2% | 1.1% |
| Maximum | 100.0% | 18.8% |
| Range | 98.8% | 17.7% |
| Mean | 17.3% | 7.0% |
| Median | 8.9% | 5.6% |
| Interquartile 25% (IQ1) | 7.9% | 4.8% |
| Interquartile 75% (IQ3) | 15.9% | 7.3% |
| Interquartile Range (IQR) | 8.0% | 2.5% |
| Standard Deviation (Sample) | 20.2% | 3.7% |
| Standard Deviation (Population) | 20.1% | 3.7% |
Similar Demographics by Disability Age 18 to 34
Demographics Similar to English by Disability Age 18 to 34
In terms of disability age 18 to 34, the demographic groups most similar to English are Menominee (7.8%, a difference of 0.080%), Shoshone (7.8%, a difference of 0.16%), Scotch-Irish (7.8%, a difference of 0.26%), Pennsylvania German (7.8%, a difference of 0.28%), and Alaska Native (7.8%, a difference of 0.30%).
| Demographics | Rating | Rank | Disability Age 18 to 34 |
| Germans | 0.0 /100 | #299 | Tragic 7.7% |
| Scottish | 0.0 /100 | #300 | Tragic 7.7% |
| Pima | 0.0 /100 | #301 | Tragic 7.7% |
| Welsh | 0.0 /100 | #302 | Tragic 7.7% |
| Cheyenne | 0.0 /100 | #303 | Tragic 7.7% |
| Shoshone | 0.0 /100 | #304 | Tragic 7.8% |
| Menominee | 0.0 /100 | #305 | Tragic 7.8% |
| English | 0.0 /100 | #306 | Tragic 7.8% |
| Scotch-Irish | 0.0 /100 | #307 | Tragic 7.8% |
| Pennsylvania Germans | 0.0 /100 | #308 | Tragic 7.8% |
| Alaska Natives | 0.0 /100 | #309 | Tragic 7.8% |
| Finns | 0.0 /100 | #310 | Tragic 7.8% |
| French | 0.0 /100 | #311 | Tragic 7.9% |
| Spanish Americans | 0.0 /100 | #312 | Tragic 7.9% |
| Iroquois | 0.0 /100 | #313 | Tragic 7.9% |
Demographics Similar to Taiwanese by Disability Age 18 to 34
In terms of disability age 18 to 34, the demographic groups most similar to Taiwanese are Salvadoran (6.0%, a difference of 0.010%), Peruvian (6.0%, a difference of 0.070%), British West Indian (6.0%, a difference of 0.090%), Trinidadian and Tobagonian (6.0%, a difference of 0.14%), and Burmese (6.0%, a difference of 0.28%).
| Demographics | Rating | Rank | Disability Age 18 to 34 |
| Immigrants | Haiti | 99.7 /100 | #57 | Exceptional 5.9% |
| Immigrants | Serbia | 99.7 /100 | #58 | Exceptional 5.9% |
| Immigrants | Caribbean | 99.6 /100 | #59 | Exceptional 6.0% |
| Immigrants | Sri Lanka | 99.6 /100 | #60 | Exceptional 6.0% |
| British West Indians | 99.6 /100 | #61 | Exceptional 6.0% |
| Peruvians | 99.6 /100 | #62 | Exceptional 6.0% |
| Salvadorans | 99.6 /100 | #63 | Exceptional 6.0% |
| Taiwanese | 99.6 /100 | #64 | Exceptional 6.0% |
| Trinidadians and Tobagonians | 99.5 /100 | #65 | Exceptional 6.0% |
| Burmese | 99.5 /100 | #66 | Exceptional 6.0% |
| Immigrants | North Macedonia | 99.5 /100 | #67 | Exceptional 6.0% |
| Immigrants | Poland | 99.5 /100 | #68 | Exceptional 6.0% |
| Immigrants | West Indies | 99.4 /100 | #69 | Exceptional 6.0% |
| Immigrants | Greece | 99.4 /100 | #70 | Exceptional 6.0% |
| Immigrants | Japan | 99.3 /100 | #71 | Exceptional 6.0% |