English vs Immigrants from Sri Lanka Unemployment Among Ages 20 to 24 years
COMPARE
English
Immigrants from Sri Lanka
Unemployment Among Ages 20 to 24 years
Unemployment Among Ages 20 to 24 years Comparison
English
Immigrants from Sri Lanka
9.8%
UNEMPLOYMENT AMONG AGES 20 TO 24 YEARS
99.5/ 100
METRIC RATING
59th/ 347
METRIC RANK
10.5%
UNEMPLOYMENT AMONG AGES 20 TO 24 YEARS
14.0/ 100
METRIC RATING
212th/ 347
METRIC RANK
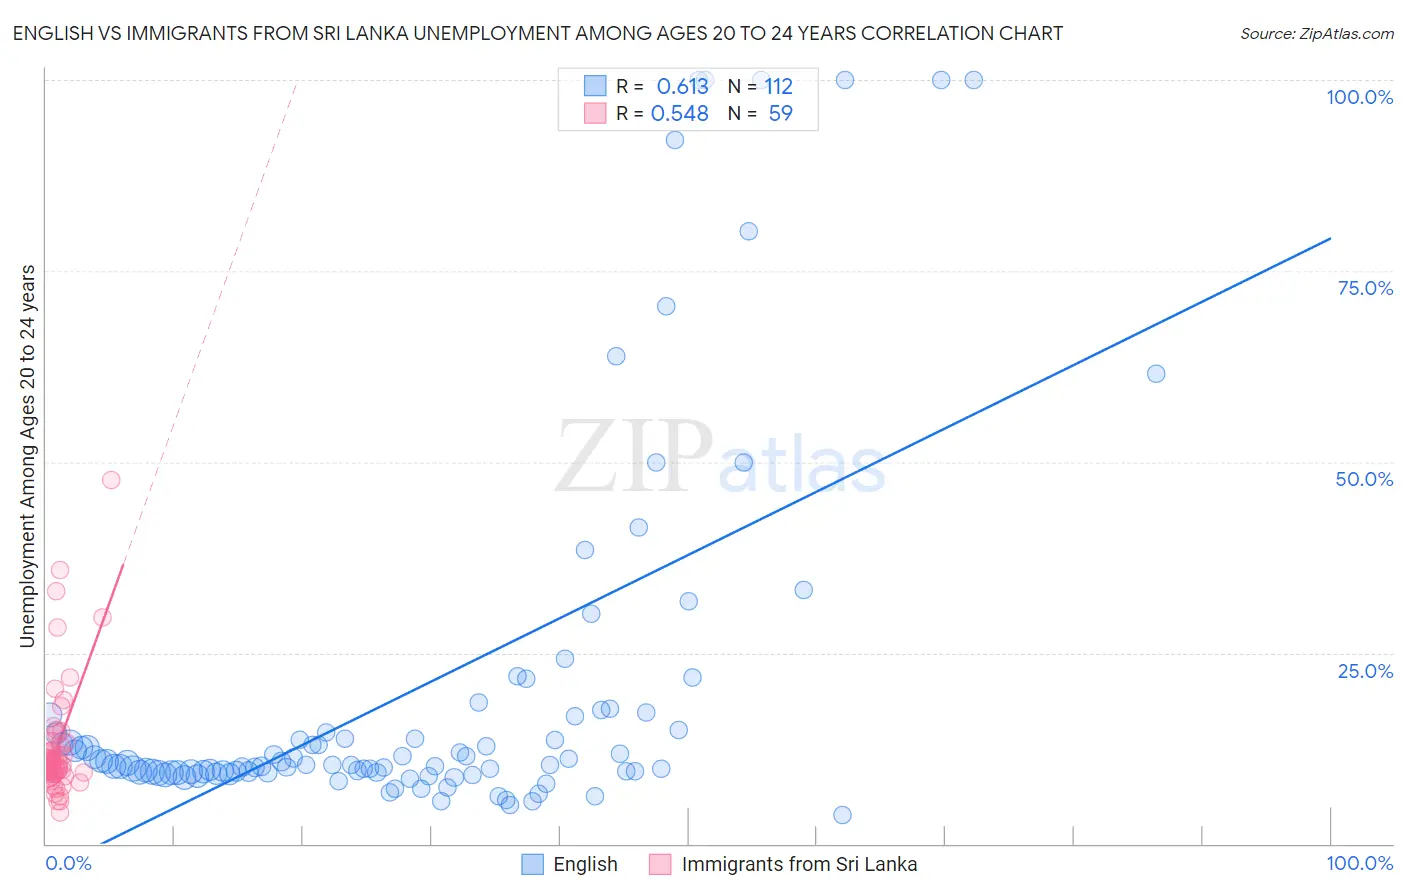
English vs Immigrants from Sri Lanka Unemployment Among Ages 20 to 24 years Correlation Chart
The statistical analysis conducted on geographies consisting of 526,770,694 people shows a significant positive correlation between the proportion of English and unemployment rate among population between the ages 20 and 24 in the United States with a correlation coefficient (R) of 0.613 and weighted average of 9.8%. Similarly, the statistical analysis conducted on geographies consisting of 148,758,891 people shows a substantial positive correlation between the proportion of Immigrants from Sri Lanka and unemployment rate among population between the ages 20 and 24 in the United States with a correlation coefficient (R) of 0.548 and weighted average of 10.5%, a difference of 6.8%.
Unemployment Among Ages 20 to 24 years Correlation Summary
| Measurement | English | Immigrants from Sri Lanka |
| Minimum | 3.8% | 4.1% |
| Maximum | 100.0% | 47.7% |
| Range | 96.2% | 43.6% |
| Mean | 20.3% | 12.9% |
| Median | 10.4% | 10.6% |
| Interquartile 25% (IQ1) | 9.3% | 9.4% |
| Interquartile 75% (IQ3) | 15.8% | 13.3% |
| Interquartile Range (IQR) | 6.5% | 3.9% |
| Standard Deviation (Sample) | 24.3% | 7.8% |
| Standard Deviation (Population) | 24.2% | 7.7% |
Similar Demographics by Unemployment Among Ages 20 to 24 years
Demographics Similar to English by Unemployment Among Ages 20 to 24 years
In terms of unemployment among ages 20 to 24 years, the demographic groups most similar to English are Pakistani (9.8%, a difference of 0.0%), Immigrants from Kuwait (9.8%, a difference of 0.030%), Immigrants from Moldova (9.8%, a difference of 0.050%), Malaysian (9.8%, a difference of 0.050%), and Immigrants from Singapore (9.8%, a difference of 0.15%).
| Demographics | Rating | Rank | Unemployment Among Ages 20 to 24 years |
| Immigrants | Thailand | 99.7 /100 | #52 | Exceptional 9.8% |
| Immigrants | Serbia | 99.6 /100 | #53 | Exceptional 9.8% |
| Immigrants | Cambodia | 99.6 /100 | #54 | Exceptional 9.8% |
| Carpatho Rusyns | 99.6 /100 | #55 | Exceptional 9.8% |
| Nicaraguans | 99.6 /100 | #56 | Exceptional 9.8% |
| Immigrants | Moldova | 99.5 /100 | #57 | Exceptional 9.8% |
| Pakistanis | 99.5 /100 | #58 | Exceptional 9.8% |
| English | 99.5 /100 | #59 | Exceptional 9.8% |
| Immigrants | Kuwait | 99.5 /100 | #60 | Exceptional 9.8% |
| Malaysians | 99.5 /100 | #61 | Exceptional 9.8% |
| Immigrants | Singapore | 99.4 /100 | #62 | Exceptional 9.8% |
| British | 99.4 /100 | #63 | Exceptional 9.8% |
| Serbians | 99.4 /100 | #64 | Exceptional 9.8% |
| Welsh | 99.3 /100 | #65 | Exceptional 9.8% |
| Scottish | 99.3 /100 | #66 | Exceptional 9.8% |
Demographics Similar to Immigrants from Sri Lanka by Unemployment Among Ages 20 to 24 years
In terms of unemployment among ages 20 to 24 years, the demographic groups most similar to Immigrants from Sri Lanka are Immigrants from Guatemala (10.5%, a difference of 0.040%), Guatemalan (10.5%, a difference of 0.14%), Kiowa (10.5%, a difference of 0.18%), Immigrants from Belgium (10.5%, a difference of 0.20%), and Peruvian (10.5%, a difference of 0.22%).
| Demographics | Rating | Rank | Unemployment Among Ages 20 to 24 years |
| Cypriots | 18.9 /100 | #205 | Poor 10.4% |
| Immigrants | Europe | 18.5 /100 | #206 | Poor 10.4% |
| Immigrants | Honduras | 17.9 /100 | #207 | Poor 10.4% |
| Immigrants | Hong Kong | 17.6 /100 | #208 | Poor 10.5% |
| Peruvians | 17.2 /100 | #209 | Poor 10.5% |
| Immigrants | Belgium | 16.9 /100 | #210 | Poor 10.5% |
| Immigrants | Guatemala | 14.6 /100 | #211 | Poor 10.5% |
| Immigrants | Sri Lanka | 14.0 /100 | #212 | Poor 10.5% |
| Guatemalans | 12.2 /100 | #213 | Poor 10.5% |
| Kiowa | 11.7 /100 | #214 | Poor 10.5% |
| Hondurans | 10.5 /100 | #215 | Poor 10.5% |
| Costa Ricans | 9.6 /100 | #216 | Tragic 10.5% |
| Cherokee | 9.3 /100 | #217 | Tragic 10.5% |
| Immigrants | Nonimmigrants | 8.8 /100 | #218 | Tragic 10.5% |
| Immigrants | Southern Europe | 8.0 /100 | #219 | Tragic 10.5% |