Immigrants from Kuwait vs Immigrants from Sri Lanka Householder Income Under 25 years
COMPARE
Immigrants from Kuwait
Immigrants from Sri Lanka
Householder Income Under 25 years
Householder Income Under 25 years Comparison
Immigrants from Kuwait
Immigrants from Sri Lanka
$48,126
HOUSEHOLDER INCOME UNDER 25 YEARS
0.0/ 100
METRIC RATING
301st/ 347
METRIC RANK
$54,512
HOUSEHOLDER INCOME UNDER 25 YEARS
99.7/ 100
METRIC RATING
75th/ 347
METRIC RANK
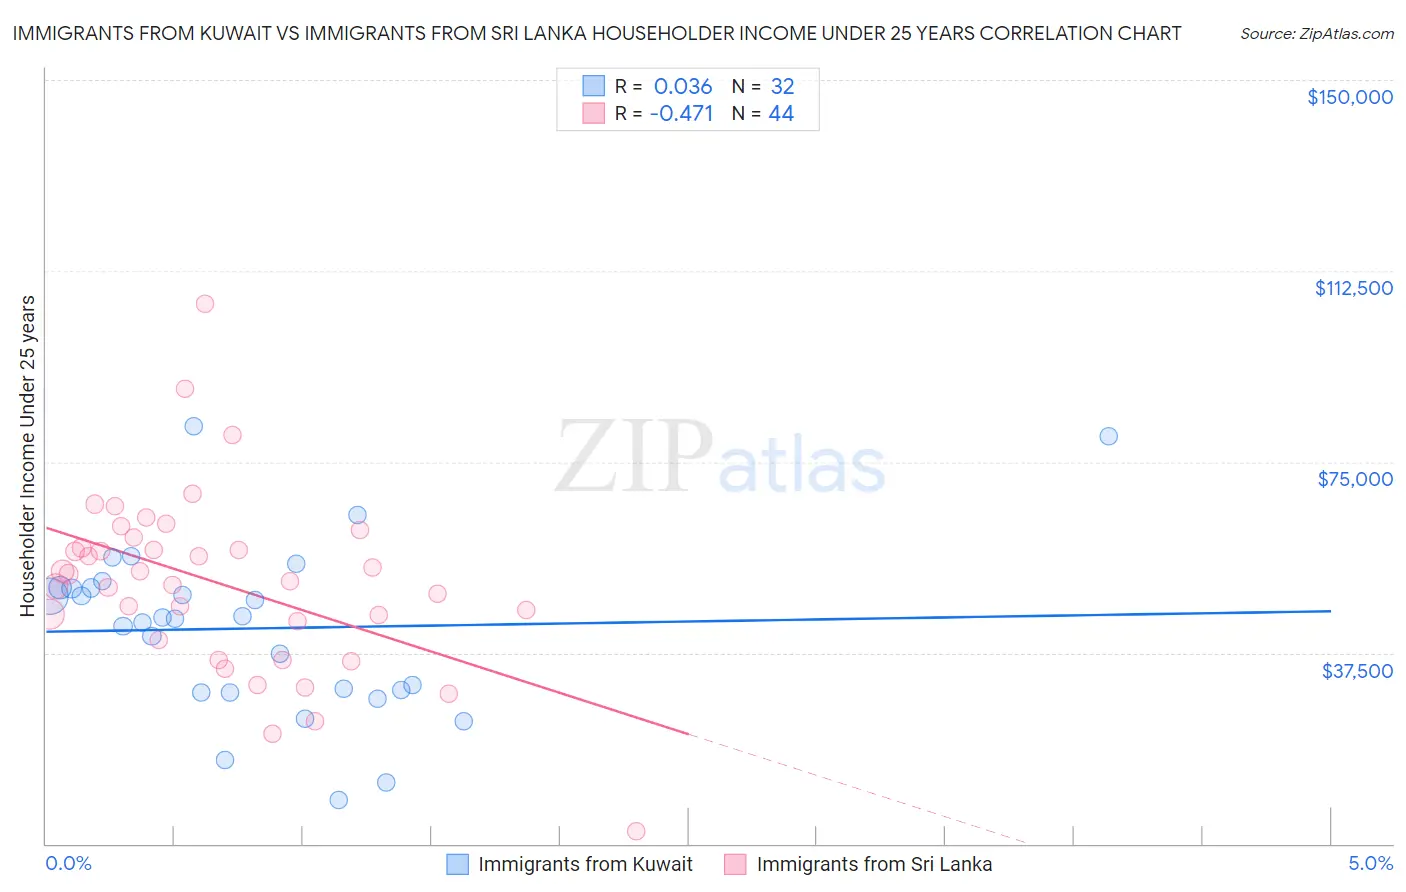
Immigrants from Kuwait vs Immigrants from Sri Lanka Householder Income Under 25 years Correlation Chart
The statistical analysis conducted on geographies consisting of 126,358,958 people shows no correlation between the proportion of Immigrants from Kuwait and household income with householder under the age of 25 in the United States with a correlation coefficient (R) of 0.036 and weighted average of $48,126. Similarly, the statistical analysis conducted on geographies consisting of 135,453,880 people shows a moderate negative correlation between the proportion of Immigrants from Sri Lanka and household income with householder under the age of 25 in the United States with a correlation coefficient (R) of -0.471 and weighted average of $54,512, a difference of 13.3%.
Householder Income Under 25 years Correlation Summary
| Measurement | Immigrants from Kuwait | Immigrants from Sri Lanka |
| Minimum | $8,680 | $2,499 |
| Maximum | $81,978 | $106,141 |
| Range | $73,298 | $103,642 |
| Mean | $42,291 | $51,174 |
| Median | $44,394 | $52,217 |
| Interquartile 25% (IQ1) | $29,899 | $41,813 |
| Interquartile 75% (IQ3) | $50,227 | $59,206 |
| Interquartile Range (IQR) | $20,328 | $17,393 |
| Standard Deviation (Sample) | $16,858 | $17,787 |
| Standard Deviation (Population) | $16,592 | $17,584 |
Similar Demographics by Householder Income Under 25 years
Demographics Similar to Immigrants from Kuwait by Householder Income Under 25 years
In terms of householder income under 25 years, the demographic groups most similar to Immigrants from Kuwait are Immigrants from Somalia ($48,135, a difference of 0.020%), Immigrants from Honduras ($48,267, a difference of 0.29%), Immigrants from Liberia ($47,981, a difference of 0.30%), Yaqui ($48,300, a difference of 0.36%), and Immigrants from Middle Africa ($47,916, a difference of 0.44%).
| Demographics | Rating | Rank | Householder Income Under 25 years |
| Somalis | 0.0 /100 | #294 | Tragic $48,657 |
| Central American Indians | 0.0 /100 | #295 | Tragic $48,643 |
| Blackfeet | 0.0 /100 | #296 | Tragic $48,603 |
| Cree | 0.0 /100 | #297 | Tragic $48,514 |
| Yaqui | 0.0 /100 | #298 | Tragic $48,300 |
| Immigrants | Honduras | 0.0 /100 | #299 | Tragic $48,267 |
| Immigrants | Somalia | 0.0 /100 | #300 | Tragic $48,135 |
| Immigrants | Kuwait | 0.0 /100 | #301 | Tragic $48,126 |
| Immigrants | Liberia | 0.0 /100 | #302 | Tragic $47,981 |
| Immigrants | Middle Africa | 0.0 /100 | #303 | Tragic $47,916 |
| Menominee | 0.0 /100 | #304 | Tragic $47,907 |
| Cherokee | 0.0 /100 | #305 | Tragic $47,848 |
| Natives/Alaskans | 0.0 /100 | #306 | Tragic $47,704 |
| Bangladeshis | 0.0 /100 | #307 | Tragic $47,589 |
| Comanche | 0.0 /100 | #308 | Tragic $47,518 |
Demographics Similar to Immigrants from Sri Lanka by Householder Income Under 25 years
In terms of householder income under 25 years, the demographic groups most similar to Immigrants from Sri Lanka are Immigrants from Grenada ($54,538, a difference of 0.050%), Immigrants from Brazil ($54,487, a difference of 0.050%), Immigrants from Southern Europe ($54,484, a difference of 0.050%), Nepalese ($54,472, a difference of 0.070%), and Macedonian ($54,563, a difference of 0.090%).
| Demographics | Rating | Rank | Householder Income Under 25 years |
| Tsimshian | 99.8 /100 | #68 | Exceptional $54,649 |
| Samoans | 99.7 /100 | #69 | Exceptional $54,610 |
| Immigrants | El Salvador | 99.7 /100 | #70 | Exceptional $54,599 |
| Immigrants | Morocco | 99.7 /100 | #71 | Exceptional $54,593 |
| Immigrants | Northern Europe | 99.7 /100 | #72 | Exceptional $54,571 |
| Macedonians | 99.7 /100 | #73 | Exceptional $54,563 |
| Immigrants | Grenada | 99.7 /100 | #74 | Exceptional $54,538 |
| Immigrants | Sri Lanka | 99.7 /100 | #75 | Exceptional $54,512 |
| Immigrants | Brazil | 99.6 /100 | #76 | Exceptional $54,487 |
| Immigrants | Southern Europe | 99.6 /100 | #77 | Exceptional $54,484 |
| Nepalese | 99.6 /100 | #78 | Exceptional $54,472 |
| Immigrants | Italy | 99.6 /100 | #79 | Exceptional $54,449 |
| Egyptians | 99.6 /100 | #80 | Exceptional $54,444 |
| Portuguese | 99.6 /100 | #81 | Exceptional $54,436 |
| Russians | 99.5 /100 | #82 | Exceptional $54,389 |