English vs Blackfeet Householder Income Ages 45 - 64 years
COMPARE
English
Blackfeet
Householder Income Ages 45 - 64 years
Householder Income Ages 45 - 64 years Comparison
English
Blackfeet
$102,021
HOUSEHOLDER INCOME AGES 45 - 64 YEARS
70.1/ 100
METRIC RATING
163rd/ 347
METRIC RANK
$86,595
HOUSEHOLDER INCOME AGES 45 - 64 YEARS
0.1/ 100
METRIC RATING
285th/ 347
METRIC RANK
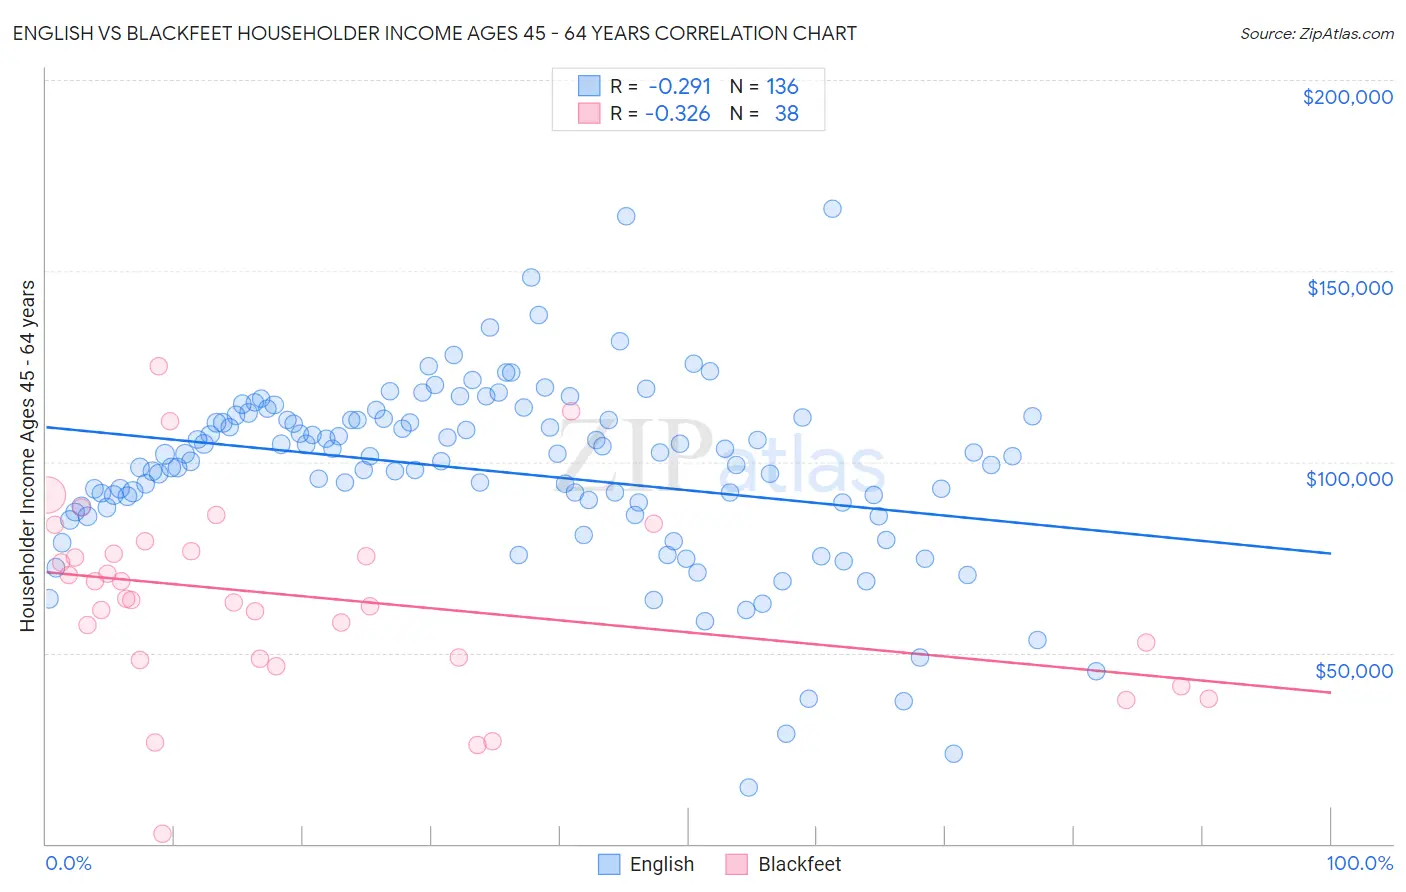
English vs Blackfeet Householder Income Ages 45 - 64 years Correlation Chart
The statistical analysis conducted on geographies consisting of 574,771,761 people shows a weak negative correlation between the proportion of English and household income with householder between the ages 45 and 64 in the United States with a correlation coefficient (R) of -0.291 and weighted average of $102,021. Similarly, the statistical analysis conducted on geographies consisting of 309,065,778 people shows a mild negative correlation between the proportion of Blackfeet and household income with householder between the ages 45 and 64 in the United States with a correlation coefficient (R) of -0.326 and weighted average of $86,595, a difference of 17.8%.
Householder Income Ages 45 - 64 years Correlation Summary
| Measurement | English | Blackfeet |
| Minimum | $14,575 | $2,499 |
| Maximum | $166,250 | $124,961 |
| Range | $151,675 | $122,462 |
| Mean | $97,518 | $64,472 |
| Median | $101,539 | $63,965 |
| Interquartile 25% (IQ1) | $88,185 | $48,500 |
| Interquartile 75% (IQ3) | $111,242 | $76,463 |
| Interquartile Range (IQR) | $23,057 | $27,963 |
| Standard Deviation (Sample) | $24,105 | $24,942 |
| Standard Deviation (Population) | $24,016 | $24,611 |
Similar Demographics by Householder Income Ages 45 - 64 years
Demographics Similar to English by Householder Income Ages 45 - 64 years
In terms of householder income ages 45 - 64 years, the demographic groups most similar to English are Immigrants from Morocco ($102,015, a difference of 0.010%), Immigrants from Albania ($101,957, a difference of 0.060%), Scottish ($102,123, a difference of 0.10%), Immigrants from Nepal ($102,190, a difference of 0.17%), and Icelander ($102,261, a difference of 0.24%).
| Demographics | Rating | Rank | Householder Income Ages 45 - 64 years |
| Carpatho Rusyns | 77.4 /100 | #156 | Good $102,777 |
| Immigrants | Ethiopia | 77.3 /100 | #157 | Good $102,763 |
| Slavs | 76.1 /100 | #158 | Good $102,629 |
| Sierra Leoneans | 74.2 /100 | #159 | Good $102,427 |
| Icelanders | 72.5 /100 | #160 | Good $102,261 |
| Immigrants | Nepal | 71.8 /100 | #161 | Good $102,190 |
| Scottish | 71.1 /100 | #162 | Good $102,123 |
| English | 70.1 /100 | #163 | Good $102,021 |
| Immigrants | Morocco | 70.0 /100 | #164 | Good $102,015 |
| Immigrants | Albania | 69.4 /100 | #165 | Good $101,957 |
| Samoans | 65.3 /100 | #166 | Good $101,580 |
| Czechoslovakians | 63.0 /100 | #167 | Good $101,387 |
| South American Indians | 60.5 /100 | #168 | Good $101,171 |
| Guamanians/Chamorros | 60.5 /100 | #169 | Good $101,170 |
| Slovaks | 58.8 /100 | #170 | Average $101,029 |
Demographics Similar to Blackfeet by Householder Income Ages 45 - 64 years
In terms of householder income ages 45 - 64 years, the demographic groups most similar to Blackfeet are Immigrants from Guatemala ($86,573, a difference of 0.030%), Central American Indian ($86,764, a difference of 0.20%), Bangladeshi ($86,402, a difference of 0.22%), Immigrants from St. Vincent and the Grenadines ($86,394, a difference of 0.23%), and Mexican ($86,816, a difference of 0.25%).
| Demographics | Rating | Rank | Householder Income Ages 45 - 64 years |
| Immigrants | Jamaica | 0.1 /100 | #278 | Tragic $87,035 |
| Yakama | 0.1 /100 | #279 | Tragic $86,992 |
| Immigrants | Somalia | 0.1 /100 | #280 | Tragic $86,987 |
| Yaqui | 0.1 /100 | #281 | Tragic $86,914 |
| Senegalese | 0.1 /100 | #282 | Tragic $86,897 |
| Mexicans | 0.1 /100 | #283 | Tragic $86,816 |
| Central American Indians | 0.1 /100 | #284 | Tragic $86,764 |
| Blackfeet | 0.1 /100 | #285 | Tragic $86,595 |
| Immigrants | Guatemala | 0.1 /100 | #286 | Tragic $86,573 |
| Bangladeshis | 0.1 /100 | #287 | Tragic $86,402 |
| Immigrants | St. Vincent and the Grenadines | 0.1 /100 | #288 | Tragic $86,394 |
| Cubans | 0.1 /100 | #289 | Tragic $86,301 |
| Cherokee | 0.1 /100 | #290 | Tragic $86,125 |
| Hispanics or Latinos | 0.1 /100 | #291 | Tragic $86,006 |
| Immigrants | Central America | 0.1 /100 | #292 | Tragic $85,965 |