Egyptian vs Immigrants from North Macedonia Median Female Earnings
COMPARE
Egyptian
Immigrants from North Macedonia
Median Female Earnings
Median Female Earnings Comparison
Egyptians
Immigrants from North Macedonia
$43,305
MEDIAN FEMALE EARNINGS
99.9/ 100
METRIC RATING
55th/ 347
METRIC RANK
$40,488
MEDIAN FEMALE EARNINGS
83.8/ 100
METRIC RATING
144th/ 347
METRIC RANK
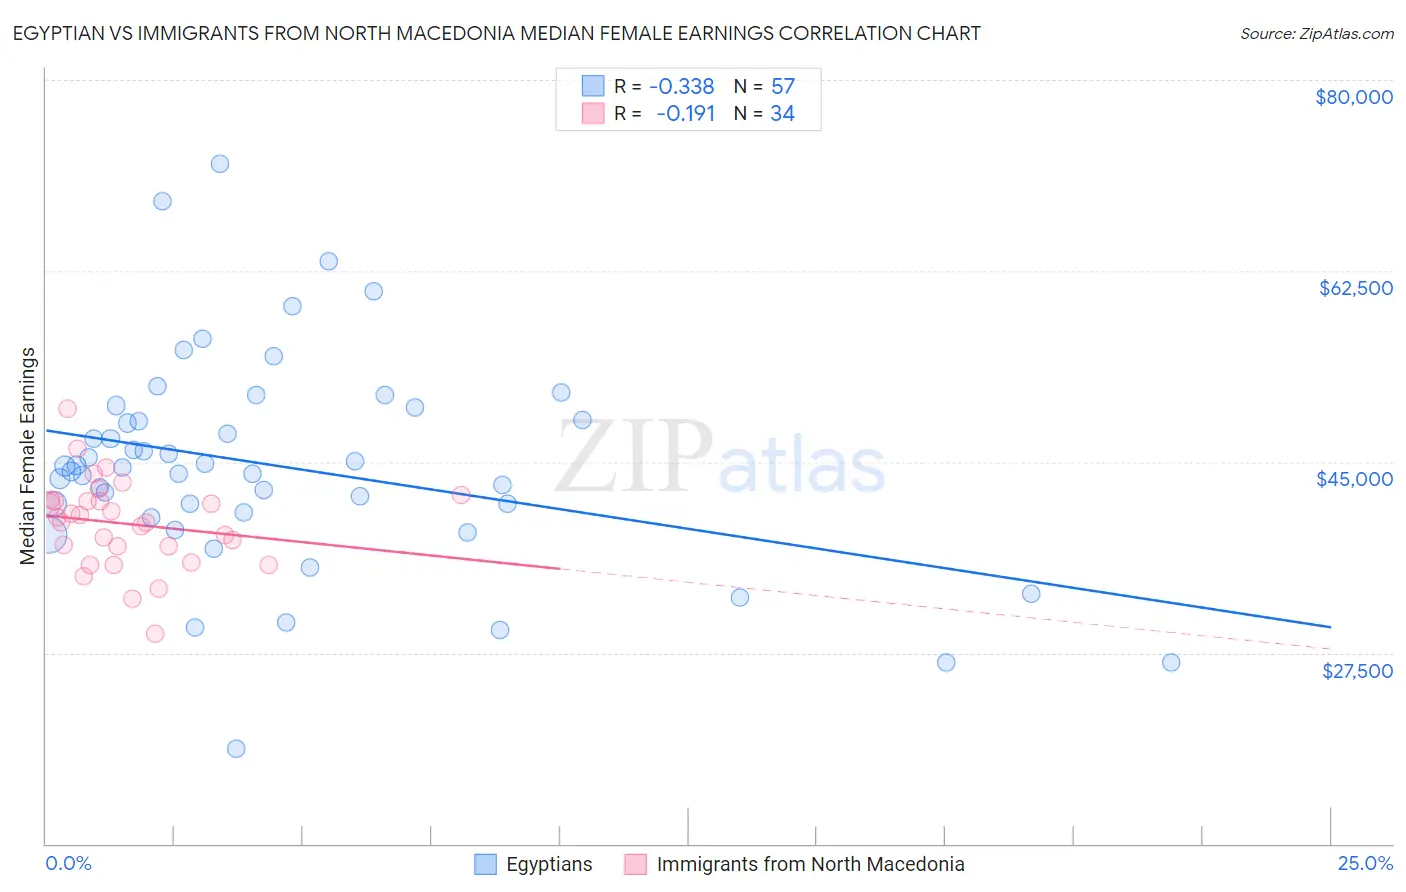
Egyptian vs Immigrants from North Macedonia Median Female Earnings Correlation Chart
The statistical analysis conducted on geographies consisting of 276,887,423 people shows a mild negative correlation between the proportion of Egyptians and median female earnings in the United States with a correlation coefficient (R) of -0.338 and weighted average of $43,305. Similarly, the statistical analysis conducted on geographies consisting of 74,042,106 people shows a poor negative correlation between the proportion of Immigrants from North Macedonia and median female earnings in the United States with a correlation coefficient (R) of -0.191 and weighted average of $40,488, a difference of 7.0%.
Median Female Earnings Correlation Summary
| Measurement | Egyptian | Immigrants from North Macedonia |
| Minimum | $18,750 | $29,254 |
| Maximum | $72,362 | $49,827 |
| Range | $53,612 | $20,573 |
| Mean | $44,581 | $39,315 |
| Median | $44,449 | $39,666 |
| Interquartile 25% (IQ1) | $40,134 | $37,214 |
| Interquartile 75% (IQ3) | $49,358 | $41,437 |
| Interquartile Range (IQR) | $9,224 | $4,223 |
| Standard Deviation (Sample) | $9,878 | $4,067 |
| Standard Deviation (Population) | $9,791 | $4,007 |
Similar Demographics by Median Female Earnings
Demographics Similar to Egyptians by Median Female Earnings
In terms of median female earnings, the demographic groups most similar to Egyptians are Immigrants from Eastern Europe ($43,309, a difference of 0.010%), Australian ($43,308, a difference of 0.010%), Immigrants from Lithuania ($43,317, a difference of 0.030%), Immigrants from Croatia ($43,258, a difference of 0.11%), and Maltese ($43,357, a difference of 0.12%).
| Demographics | Rating | Rank | Median Female Earnings |
| Immigrants | Indonesia | 100.0 /100 | #48 | Exceptional $43,412 |
| Immigrants | Serbia | 100.0 /100 | #49 | Exceptional $43,385 |
| Immigrants | Uzbekistan | 100.0 /100 | #50 | Exceptional $43,363 |
| Maltese | 100.0 /100 | #51 | Exceptional $43,357 |
| Immigrants | Lithuania | 99.9 /100 | #52 | Exceptional $43,317 |
| Immigrants | Eastern Europe | 99.9 /100 | #53 | Exceptional $43,309 |
| Australians | 99.9 /100 | #54 | Exceptional $43,308 |
| Egyptians | 99.9 /100 | #55 | Exceptional $43,305 |
| Immigrants | Croatia | 99.9 /100 | #56 | Exceptional $43,258 |
| Ethiopians | 99.9 /100 | #57 | Exceptional $43,243 |
| Paraguayans | 99.9 /100 | #58 | Exceptional $43,173 |
| Estonians | 99.9 /100 | #59 | Exceptional $43,106 |
| Immigrants | Latvia | 99.9 /100 | #60 | Exceptional $43,099 |
| Immigrants | Bulgaria | 99.9 /100 | #61 | Exceptional $43,085 |
| Afghans | 99.9 /100 | #62 | Exceptional $43,077 |
Demographics Similar to Immigrants from North Macedonia by Median Female Earnings
In terms of median female earnings, the demographic groups most similar to Immigrants from North Macedonia are Northern European ($40,491, a difference of 0.010%), Brazilian ($40,483, a difference of 0.010%), Sri Lankan ($40,496, a difference of 0.020%), Immigrants from Syria ($40,499, a difference of 0.030%), and Serbian ($40,539, a difference of 0.12%).
| Demographics | Rating | Rank | Median Female Earnings |
| Pakistanis | 86.6 /100 | #137 | Excellent $40,596 |
| Taiwanese | 86.1 /100 | #138 | Excellent $40,576 |
| Immigrants | South Eastern Asia | 85.7 /100 | #139 | Excellent $40,558 |
| Serbians | 85.2 /100 | #140 | Excellent $40,539 |
| Immigrants | Syria | 84.1 /100 | #141 | Excellent $40,499 |
| Sri Lankans | 84.0 /100 | #142 | Excellent $40,496 |
| Northern Europeans | 83.9 /100 | #143 | Excellent $40,491 |
| Immigrants | North Macedonia | 83.8 /100 | #144 | Excellent $40,488 |
| Brazilians | 83.6 /100 | #145 | Excellent $40,483 |
| Ghanaians | 82.1 /100 | #146 | Excellent $40,429 |
| Vietnamese | 80.4 /100 | #147 | Excellent $40,377 |
| Poles | 80.2 /100 | #148 | Excellent $40,371 |
| Immigrants | Cameroon | 79.7 /100 | #149 | Good $40,354 |
| Immigrants | Chile | 79.6 /100 | #150 | Good $40,353 |
| Immigrants | Armenia | 79.2 /100 | #151 | Good $40,340 |