Dutch West Indian vs Bulgarian Householder Income Under 25 years
COMPARE
Dutch West Indian
Bulgarian
Householder Income Under 25 years
Householder Income Under 25 years Comparison
Dutch West Indians
Bulgarians
$45,816
HOUSEHOLDER INCOME UNDER 25 YEARS
0.0/ 100
METRIC RATING
324th/ 347
METRIC RANK
$54,352
HOUSEHOLDER INCOME UNDER 25 YEARS
99.5/ 100
METRIC RATING
84th/ 347
METRIC RANK
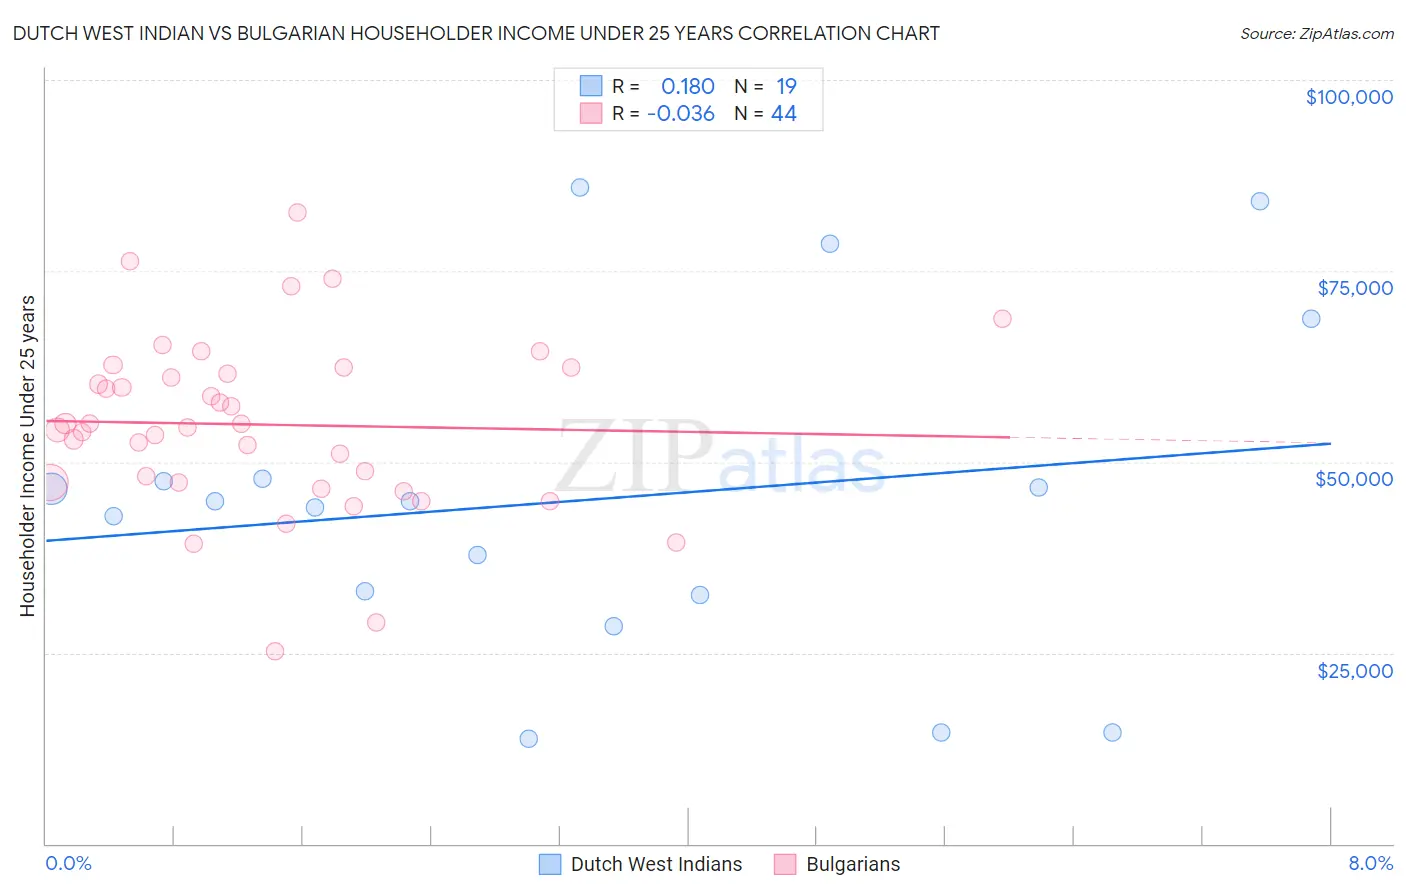
Dutch West Indian vs Bulgarian Householder Income Under 25 years Correlation Chart
The statistical analysis conducted on geographies consisting of 80,349,978 people shows a poor positive correlation between the proportion of Dutch West Indians and household income with householder under the age of 25 in the United States with a correlation coefficient (R) of 0.180 and weighted average of $45,816. Similarly, the statistical analysis conducted on geographies consisting of 184,447,475 people shows no correlation between the proportion of Bulgarians and household income with householder under the age of 25 in the United States with a correlation coefficient (R) of -0.036 and weighted average of $54,352, a difference of 18.6%.
Householder Income Under 25 years Correlation Summary
| Measurement | Dutch West Indian | Bulgarian |
| Minimum | $13,750 | $25,208 |
| Maximum | $85,865 | $82,576 |
| Range | $72,115 | $57,368 |
| Mean | $45,099 | $54,870 |
| Median | $44,797 | $54,743 |
| Interquartile 25% (IQ1) | $32,543 | $47,263 |
| Interquartile 75% (IQ3) | $47,825 | $61,883 |
| Interquartile Range (IQR) | $15,281 | $14,621 |
| Standard Deviation (Sample) | $21,553 | $11,464 |
| Standard Deviation (Population) | $20,979 | $11,333 |
Similar Demographics by Householder Income Under 25 years
Demographics Similar to Dutch West Indians by Householder Income Under 25 years
In terms of householder income under 25 years, the demographic groups most similar to Dutch West Indians are Immigrants from Bahamas ($45,793, a difference of 0.050%), Osage ($45,764, a difference of 0.11%), Bahamian ($45,743, a difference of 0.16%), German Russian ($45,673, a difference of 0.31%), and Seminole ($45,649, a difference of 0.37%).
| Demographics | Rating | Rank | Householder Income Under 25 years |
| Hopi | 0.0 /100 | #317 | Tragic $46,978 |
| Spanish Americans | 0.0 /100 | #318 | Tragic $46,913 |
| Africans | 0.0 /100 | #319 | Tragic $46,838 |
| Immigrants | Sudan | 0.0 /100 | #320 | Tragic $46,791 |
| Potawatomi | 0.0 /100 | #321 | Tragic $46,462 |
| Sioux | 0.0 /100 | #322 | Tragic $46,417 |
| Immigrants | Saudi Arabia | 0.0 /100 | #323 | Tragic $46,187 |
| Dutch West Indians | 0.0 /100 | #324 | Tragic $45,816 |
| Immigrants | Bahamas | 0.0 /100 | #325 | Tragic $45,793 |
| Osage | 0.0 /100 | #326 | Tragic $45,764 |
| Bahamians | 0.0 /100 | #327 | Tragic $45,743 |
| German Russians | 0.0 /100 | #328 | Tragic $45,673 |
| Seminole | 0.0 /100 | #329 | Tragic $45,649 |
| Indonesians | 0.0 /100 | #330 | Tragic $45,566 |
| Immigrants | Zaire | 0.0 /100 | #331 | Tragic $45,529 |
Demographics Similar to Bulgarians by Householder Income Under 25 years
In terms of householder income under 25 years, the demographic groups most similar to Bulgarians are Immigrants from Czechoslovakia ($54,352, a difference of 0.0%), Immigrants from Croatia ($54,343, a difference of 0.020%), Laotian ($54,369, a difference of 0.030%), Brazilian ($54,335, a difference of 0.030%), and Yakama ($54,321, a difference of 0.060%).
| Demographics | Rating | Rank | Householder Income Under 25 years |
| Immigrants | Southern Europe | 99.6 /100 | #77 | Exceptional $54,484 |
| Nepalese | 99.6 /100 | #78 | Exceptional $54,472 |
| Immigrants | Italy | 99.6 /100 | #79 | Exceptional $54,449 |
| Egyptians | 99.6 /100 | #80 | Exceptional $54,444 |
| Portuguese | 99.6 /100 | #81 | Exceptional $54,436 |
| Russians | 99.5 /100 | #82 | Exceptional $54,389 |
| Laotians | 99.5 /100 | #83 | Exceptional $54,369 |
| Bulgarians | 99.5 /100 | #84 | Exceptional $54,352 |
| Immigrants | Czechoslovakia | 99.5 /100 | #85 | Exceptional $54,352 |
| Immigrants | Croatia | 99.5 /100 | #86 | Exceptional $54,343 |
| Brazilians | 99.5 /100 | #87 | Exceptional $54,335 |
| Yakama | 99.5 /100 | #88 | Exceptional $54,321 |
| Immigrants | South America | 99.4 /100 | #89 | Exceptional $54,268 |
| Turks | 99.4 /100 | #90 | Exceptional $54,266 |
| Immigrants | Egypt | 99.3 /100 | #91 | Exceptional $54,239 |