Dutch West Indian vs Immigrants from St. Vincent and the Grenadines Householder Income Under 25 years
COMPARE
Dutch West Indian
Immigrants from St. Vincent and the Grenadines
Householder Income Under 25 years
Householder Income Under 25 years Comparison
Dutch West Indians
Immigrants from St. Vincent and the Grenadines
$45,816
HOUSEHOLDER INCOME UNDER 25 YEARS
0.0/ 100
METRIC RATING
324th/ 347
METRIC RANK
$54,230
HOUSEHOLDER INCOME UNDER 25 YEARS
99.3/ 100
METRIC RATING
92nd/ 347
METRIC RANK
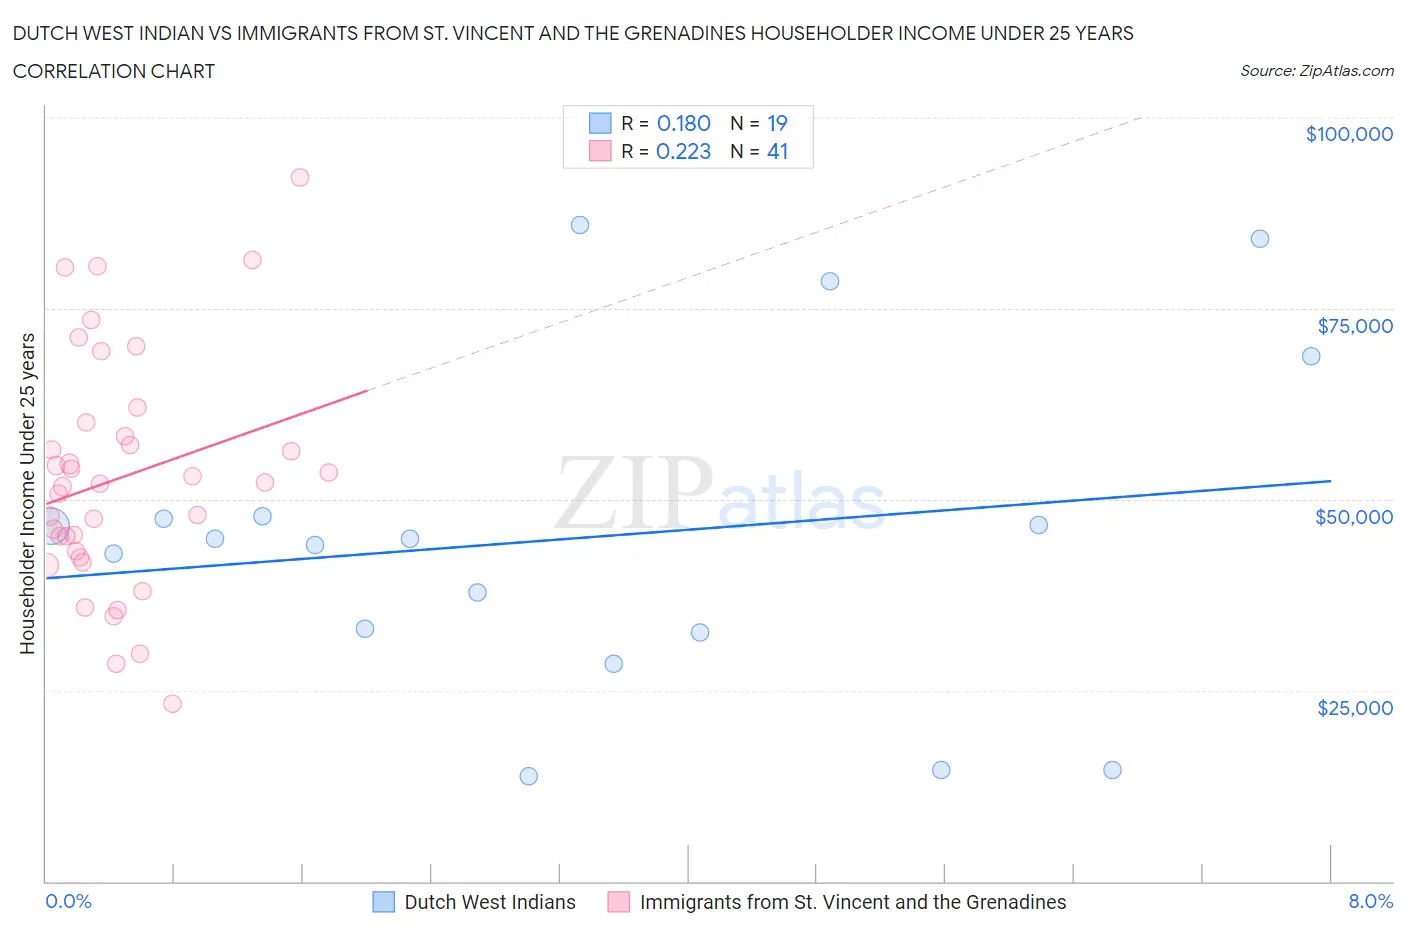
Dutch West Indian vs Immigrants from St. Vincent and the Grenadines Householder Income Under 25 years Correlation Chart
The statistical analysis conducted on geographies consisting of 80,349,978 people shows a poor positive correlation between the proportion of Dutch West Indians and household income with householder under the age of 25 in the United States with a correlation coefficient (R) of 0.180 and weighted average of $45,816. Similarly, the statistical analysis conducted on geographies consisting of 51,601,102 people shows a weak positive correlation between the proportion of Immigrants from St. Vincent and the Grenadines and household income with householder under the age of 25 in the United States with a correlation coefficient (R) of 0.223 and weighted average of $54,230, a difference of 18.4%.
Householder Income Under 25 years Correlation Summary
| Measurement | Dutch West Indian | Immigrants from St. Vincent and the Grenadines |
| Minimum | $13,750 | $23,250 |
| Maximum | $85,865 | $92,155 |
| Range | $72,115 | $68,905 |
| Mean | $45,099 | $52,801 |
| Median | $44,797 | $52,122 |
| Interquartile 25% (IQ1) | $32,543 | $42,812 |
| Interquartile 75% (IQ3) | $47,825 | $59,173 |
| Interquartile Range (IQR) | $15,281 | $16,362 |
| Standard Deviation (Sample) | $21,553 | $15,284 |
| Standard Deviation (Population) | $20,979 | $15,096 |
Similar Demographics by Householder Income Under 25 years
Demographics Similar to Dutch West Indians by Householder Income Under 25 years
In terms of householder income under 25 years, the demographic groups most similar to Dutch West Indians are Immigrants from Bahamas ($45,793, a difference of 0.050%), Osage ($45,764, a difference of 0.11%), Bahamian ($45,743, a difference of 0.16%), German Russian ($45,673, a difference of 0.31%), and Seminole ($45,649, a difference of 0.37%).
| Demographics | Rating | Rank | Householder Income Under 25 years |
| Hopi | 0.0 /100 | #317 | Tragic $46,978 |
| Spanish Americans | 0.0 /100 | #318 | Tragic $46,913 |
| Africans | 0.0 /100 | #319 | Tragic $46,838 |
| Immigrants | Sudan | 0.0 /100 | #320 | Tragic $46,791 |
| Potawatomi | 0.0 /100 | #321 | Tragic $46,462 |
| Sioux | 0.0 /100 | #322 | Tragic $46,417 |
| Immigrants | Saudi Arabia | 0.0 /100 | #323 | Tragic $46,187 |
| Dutch West Indians | 0.0 /100 | #324 | Tragic $45,816 |
| Immigrants | Bahamas | 0.0 /100 | #325 | Tragic $45,793 |
| Osage | 0.0 /100 | #326 | Tragic $45,764 |
| Bahamians | 0.0 /100 | #327 | Tragic $45,743 |
| German Russians | 0.0 /100 | #328 | Tragic $45,673 |
| Seminole | 0.0 /100 | #329 | Tragic $45,649 |
| Indonesians | 0.0 /100 | #330 | Tragic $45,566 |
| Immigrants | Zaire | 0.0 /100 | #331 | Tragic $45,529 |
Demographics Similar to Immigrants from St. Vincent and the Grenadines by Householder Income Under 25 years
In terms of householder income under 25 years, the demographic groups most similar to Immigrants from St. Vincent and the Grenadines are Immigrants from Egypt ($54,239, a difference of 0.020%), Immigrants from Argentina ($54,209, a difference of 0.040%), Immigrants from South America ($54,268, a difference of 0.070%), Turkish ($54,266, a difference of 0.070%), and Immigrants from Sierra Leone ($54,190, a difference of 0.070%).
| Demographics | Rating | Rank | Householder Income Under 25 years |
| Immigrants | Czechoslovakia | 99.5 /100 | #85 | Exceptional $54,352 |
| Immigrants | Croatia | 99.5 /100 | #86 | Exceptional $54,343 |
| Brazilians | 99.5 /100 | #87 | Exceptional $54,335 |
| Yakama | 99.5 /100 | #88 | Exceptional $54,321 |
| Immigrants | South America | 99.4 /100 | #89 | Exceptional $54,268 |
| Turks | 99.4 /100 | #90 | Exceptional $54,266 |
| Immigrants | Egypt | 99.3 /100 | #91 | Exceptional $54,239 |
| Immigrants | St. Vincent and the Grenadines | 99.3 /100 | #92 | Exceptional $54,230 |
| Immigrants | Argentina | 99.3 /100 | #93 | Exceptional $54,209 |
| Immigrants | Sierra Leone | 99.3 /100 | #94 | Exceptional $54,190 |
| Immigrants | Malaysia | 99.2 /100 | #95 | Exceptional $54,179 |
| Argentineans | 99.2 /100 | #96 | Exceptional $54,154 |
| Immigrants | Portugal | 99.1 /100 | #97 | Exceptional $54,105 |
| Eastern Europeans | 99.0 /100 | #98 | Exceptional $54,066 |
| Alaska Natives | 98.8 /100 | #99 | Exceptional $54,000 |