Immigrants from Malaysia vs Bulgarian Householder Income Under 25 years
COMPARE
Immigrants from Malaysia
Bulgarian
Householder Income Under 25 years
Householder Income Under 25 years Comparison
Immigrants from Malaysia
Bulgarians
$54,179
HOUSEHOLDER INCOME UNDER 25 YEARS
99.2/ 100
METRIC RATING
95th/ 347
METRIC RANK
$54,352
HOUSEHOLDER INCOME UNDER 25 YEARS
99.5/ 100
METRIC RATING
84th/ 347
METRIC RANK
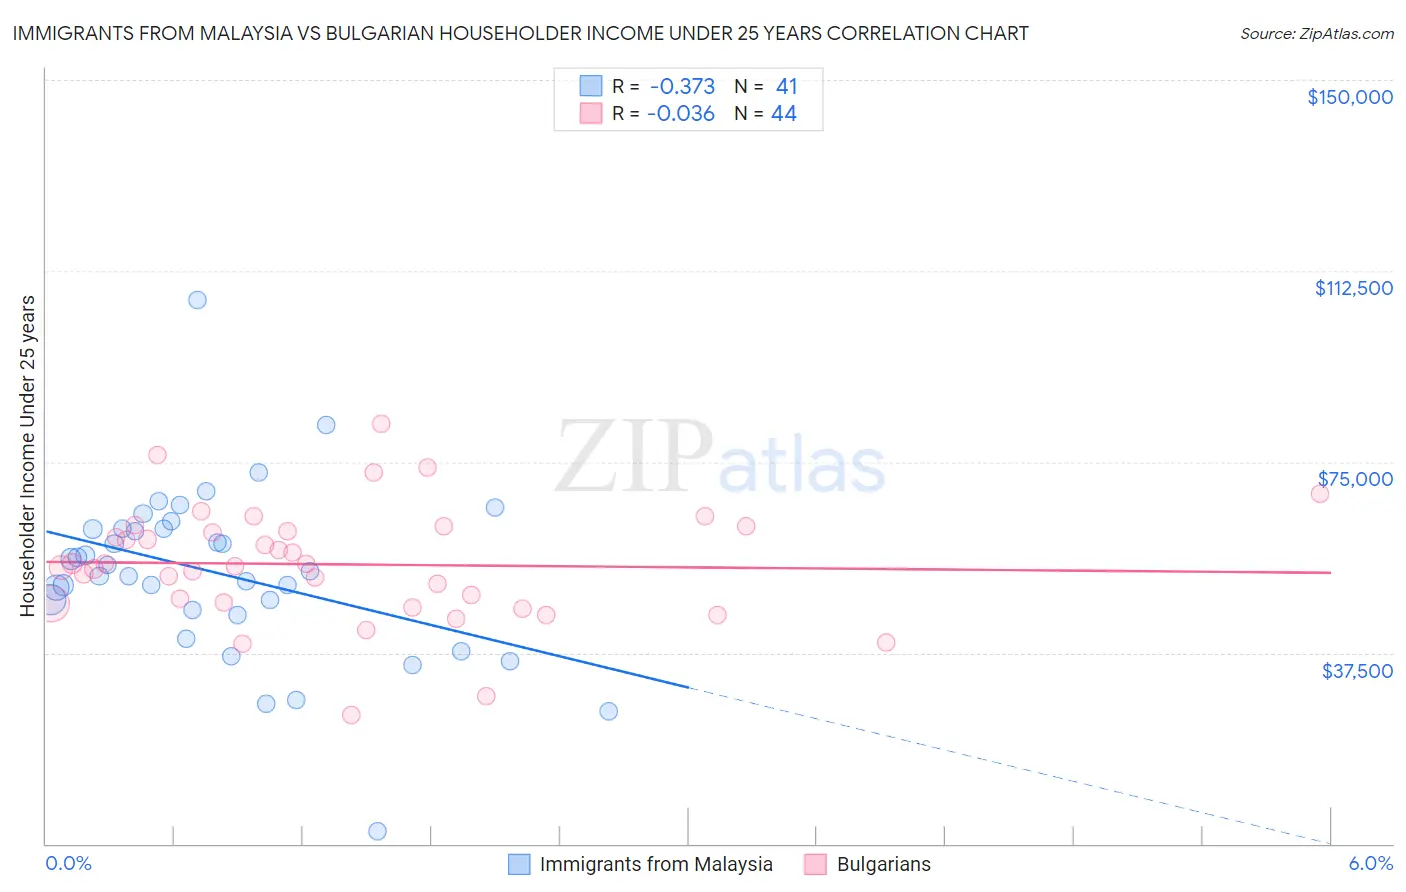
Immigrants from Malaysia vs Bulgarian Householder Income Under 25 years Correlation Chart
The statistical analysis conducted on geographies consisting of 176,157,143 people shows a mild negative correlation between the proportion of Immigrants from Malaysia and household income with householder under the age of 25 in the United States with a correlation coefficient (R) of -0.373 and weighted average of $54,179. Similarly, the statistical analysis conducted on geographies consisting of 184,447,475 people shows no correlation between the proportion of Bulgarians and household income with householder under the age of 25 in the United States with a correlation coefficient (R) of -0.036 and weighted average of $54,352, a difference of 0.32%.
Householder Income Under 25 years Correlation Summary
| Measurement | Immigrants from Malaysia | Bulgarian |
| Minimum | $2,499 | $25,208 |
| Maximum | $106,721 | $82,576 |
| Range | $104,222 | $57,368 |
| Mean | $53,085 | $54,870 |
| Median | $53,409 | $54,743 |
| Interquartile 25% (IQ1) | $45,363 | $47,263 |
| Interquartile 75% (IQ3) | $61,933 | $61,883 |
| Interquartile Range (IQR) | $16,570 | $14,621 |
| Standard Deviation (Sample) | $17,081 | $11,464 |
| Standard Deviation (Population) | $16,871 | $11,333 |
Demographics Similar to Immigrants from Malaysia and Bulgarians by Householder Income Under 25 years
In terms of householder income under 25 years, the demographic groups most similar to Immigrants from Malaysia are Immigrants from Sierra Leone ($54,190, a difference of 0.020%), Immigrants from Argentina ($54,209, a difference of 0.050%), Argentinean ($54,154, a difference of 0.050%), Immigrants from St. Vincent and the Grenadines ($54,230, a difference of 0.090%), and Immigrants from Egypt ($54,239, a difference of 0.11%). Similarly, the demographic groups most similar to Bulgarians are Immigrants from Czechoslovakia ($54,352, a difference of 0.0%), Immigrants from Croatia ($54,343, a difference of 0.020%), Laotian ($54,369, a difference of 0.030%), Brazilian ($54,335, a difference of 0.030%), and Yakama ($54,321, a difference of 0.060%).
| Demographics | Rating | Rank | Householder Income Under 25 years |
| Immigrants | Italy | 99.6 /100 | #79 | Exceptional $54,449 |
| Egyptians | 99.6 /100 | #80 | Exceptional $54,444 |
| Portuguese | 99.6 /100 | #81 | Exceptional $54,436 |
| Russians | 99.5 /100 | #82 | Exceptional $54,389 |
| Laotians | 99.5 /100 | #83 | Exceptional $54,369 |
| Bulgarians | 99.5 /100 | #84 | Exceptional $54,352 |
| Immigrants | Czechoslovakia | 99.5 /100 | #85 | Exceptional $54,352 |
| Immigrants | Croatia | 99.5 /100 | #86 | Exceptional $54,343 |
| Brazilians | 99.5 /100 | #87 | Exceptional $54,335 |
| Yakama | 99.5 /100 | #88 | Exceptional $54,321 |
| Immigrants | South America | 99.4 /100 | #89 | Exceptional $54,268 |
| Turks | 99.4 /100 | #90 | Exceptional $54,266 |
| Immigrants | Egypt | 99.3 /100 | #91 | Exceptional $54,239 |
| Immigrants | St. Vincent and the Grenadines | 99.3 /100 | #92 | Exceptional $54,230 |
| Immigrants | Argentina | 99.3 /100 | #93 | Exceptional $54,209 |
| Immigrants | Sierra Leone | 99.3 /100 | #94 | Exceptional $54,190 |
| Immigrants | Malaysia | 99.2 /100 | #95 | Exceptional $54,179 |
| Argentineans | 99.2 /100 | #96 | Exceptional $54,154 |
| Immigrants | Portugal | 99.1 /100 | #97 | Exceptional $54,105 |
| Eastern Europeans | 99.0 /100 | #98 | Exceptional $54,066 |
| Alaska Natives | 98.8 /100 | #99 | Exceptional $54,000 |