Dutch West Indian vs Bhutanese Unemployment Among Ages 55 to 59 years
COMPARE
Dutch West Indian
Bhutanese
Unemployment Among Ages 55 to 59 years
Unemployment Among Ages 55 to 59 years Comparison
Dutch West Indians
Bhutanese
5.3%
UNEMPLOYMENT AMONG AGES 55 TO 59 YEARS
0.0/ 100
METRIC RATING
295th/ 347
METRIC RANK
4.6%
UNEMPLOYMENT AMONG AGES 55 TO 59 YEARS
98.6/ 100
METRIC RATING
73rd/ 347
METRIC RANK
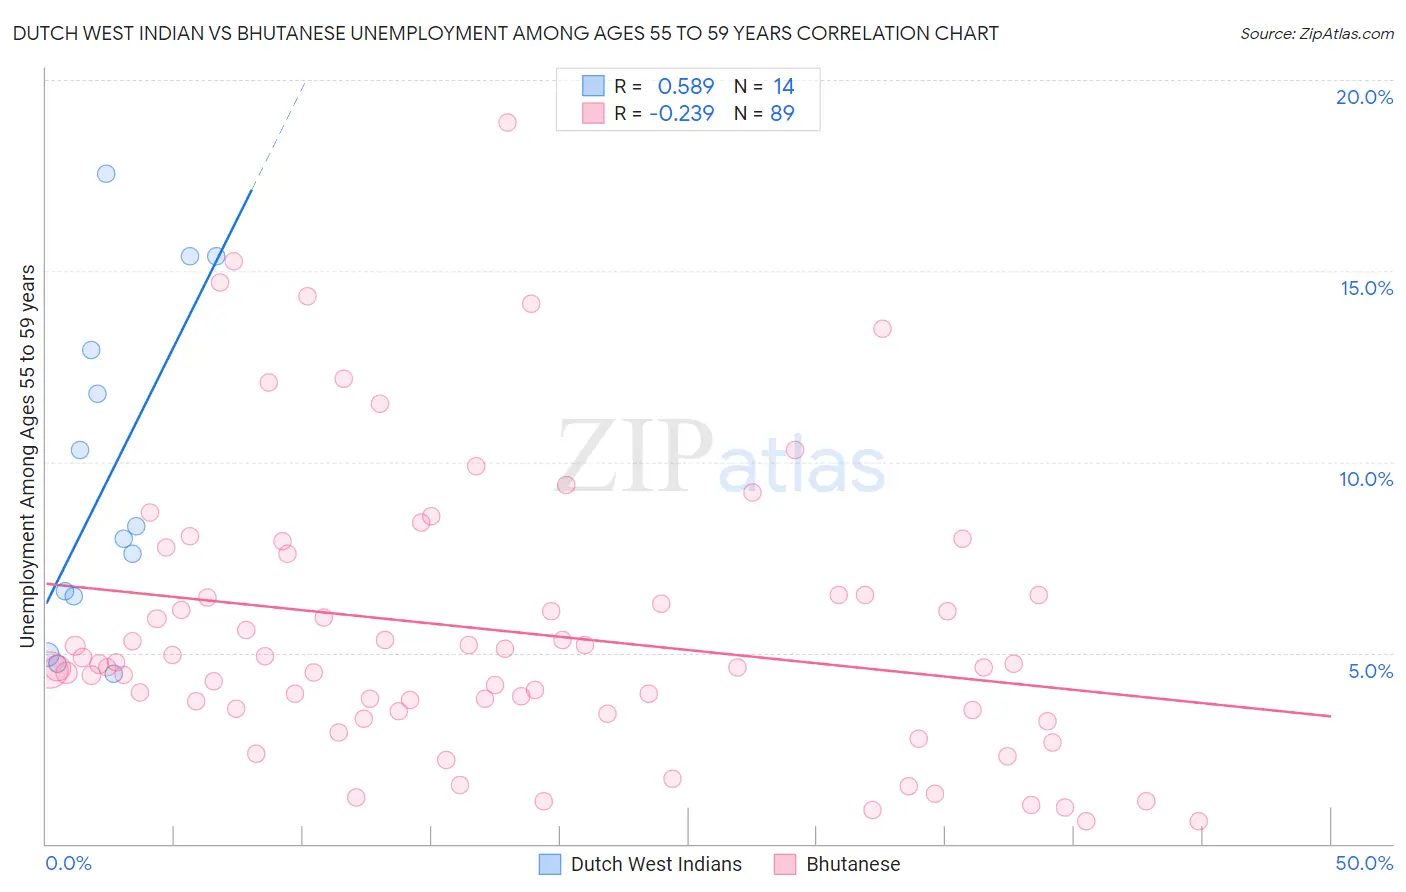
Dutch West Indian vs Bhutanese Unemployment Among Ages 55 to 59 years Correlation Chart
The statistical analysis conducted on geographies consisting of 81,812,889 people shows a substantial positive correlation between the proportion of Dutch West Indians and unemployment rate among population between the ages 55 and 59 in the United States with a correlation coefficient (R) of 0.589 and weighted average of 5.3%. Similarly, the statistical analysis conducted on geographies consisting of 415,773,298 people shows a weak negative correlation between the proportion of Bhutanese and unemployment rate among population between the ages 55 and 59 in the United States with a correlation coefficient (R) of -0.239 and weighted average of 4.6%, a difference of 15.6%.
Unemployment Among Ages 55 to 59 years Correlation Summary
| Measurement | Dutch West Indian | Bhutanese |
| Minimum | 4.5% | 0.60% |
| Maximum | 17.6% | 18.9% |
| Range | 13.1% | 18.3% |
| Mean | 9.6% | 5.6% |
| Median | 8.2% | 4.7% |
| Interquartile 25% (IQ1) | 6.5% | 3.5% |
| Interquartile 75% (IQ3) | 12.9% | 6.5% |
| Interquartile Range (IQR) | 6.4% | 3.0% |
| Standard Deviation (Sample) | 4.3% | 3.7% |
| Standard Deviation (Population) | 4.2% | 3.6% |
Similar Demographics by Unemployment Among Ages 55 to 59 years
Demographics Similar to Dutch West Indians by Unemployment Among Ages 55 to 59 years
In terms of unemployment among ages 55 to 59 years, the demographic groups most similar to Dutch West Indians are Barbadian (5.3%, a difference of 0.040%), Cajun (5.3%, a difference of 0.12%), Immigrants from Grenada (5.3%, a difference of 0.24%), Immigrants from Mexico (5.3%, a difference of 0.26%), and British West Indian (5.3%, a difference of 0.43%).
| Demographics | Rating | Rank | Unemployment Among Ages 55 to 59 years |
| Immigrants | Israel | 0.0 /100 | #288 | Tragic 5.3% |
| Immigrants | Central America | 0.0 /100 | #289 | Tragic 5.3% |
| Sioux | 0.0 /100 | #290 | Tragic 5.3% |
| Trinidadians and Tobagonians | 0.0 /100 | #291 | Tragic 5.3% |
| British West Indians | 0.0 /100 | #292 | Tragic 5.3% |
| Immigrants | Grenada | 0.0 /100 | #293 | Tragic 5.3% |
| Cajuns | 0.0 /100 | #294 | Tragic 5.3% |
| Dutch West Indians | 0.0 /100 | #295 | Tragic 5.3% |
| Barbadians | 0.0 /100 | #296 | Tragic 5.3% |
| Immigrants | Mexico | 0.0 /100 | #297 | Tragic 5.3% |
| Hispanics or Latinos | 0.0 /100 | #298 | Tragic 5.4% |
| Cape Verdeans | 0.0 /100 | #299 | Tragic 5.4% |
| Immigrants | St. Vincent and the Grenadines | 0.0 /100 | #300 | Tragic 5.4% |
| Immigrants | Dominica | 0.0 /100 | #301 | Tragic 5.5% |
| Sierra Leoneans | 0.0 /100 | #302 | Tragic 5.5% |
Demographics Similar to Bhutanese by Unemployment Among Ages 55 to 59 years
In terms of unemployment among ages 55 to 59 years, the demographic groups most similar to Bhutanese are Immigrants from Taiwan (4.6%, a difference of 0.080%), Croatian (4.6%, a difference of 0.080%), Immigrants from Iraq (4.6%, a difference of 0.090%), Immigrants from Jordan (4.6%, a difference of 0.11%), and Filipino (4.6%, a difference of 0.14%).
| Demographics | Rating | Rank | Unemployment Among Ages 55 to 59 years |
| Mongolians | 99.0 /100 | #66 | Exceptional 4.6% |
| Ugandans | 99.0 /100 | #67 | Exceptional 4.6% |
| Immigrants | Micronesia | 99.0 /100 | #68 | Exceptional 4.6% |
| Czechoslovakians | 99.0 /100 | #69 | Exceptional 4.6% |
| Filipinos | 98.8 /100 | #70 | Exceptional 4.6% |
| Immigrants | Jordan | 98.7 /100 | #71 | Exceptional 4.6% |
| Immigrants | Taiwan | 98.7 /100 | #72 | Exceptional 4.6% |
| Bhutanese | 98.6 /100 | #73 | Exceptional 4.6% |
| Croatians | 98.5 /100 | #74 | Exceptional 4.6% |
| Immigrants | Iraq | 98.5 /100 | #75 | Exceptional 4.6% |
| Immigrants | Bosnia and Herzegovina | 98.3 /100 | #76 | Exceptional 4.6% |
| Scotch-Irish | 98.3 /100 | #77 | Exceptional 4.6% |
| Finns | 98.2 /100 | #78 | Exceptional 4.6% |
| Sri Lankans | 98.1 /100 | #79 | Exceptional 4.6% |
| Cambodians | 98.0 /100 | #80 | Exceptional 4.6% |