Immigrants from Middle Africa vs Kiowa Median Female Earnings
COMPARE
Immigrants from Middle Africa
Kiowa
Median Female Earnings
Median Female Earnings Comparison
Immigrants from Middle Africa
Kiowa
$37,965
MEDIAN FEMALE EARNINGS
2.7/ 100
METRIC RATING
245th/ 347
METRIC RANK
$34,074
MEDIAN FEMALE EARNINGS
0.0/ 100
METRIC RATING
326th/ 347
METRIC RANK
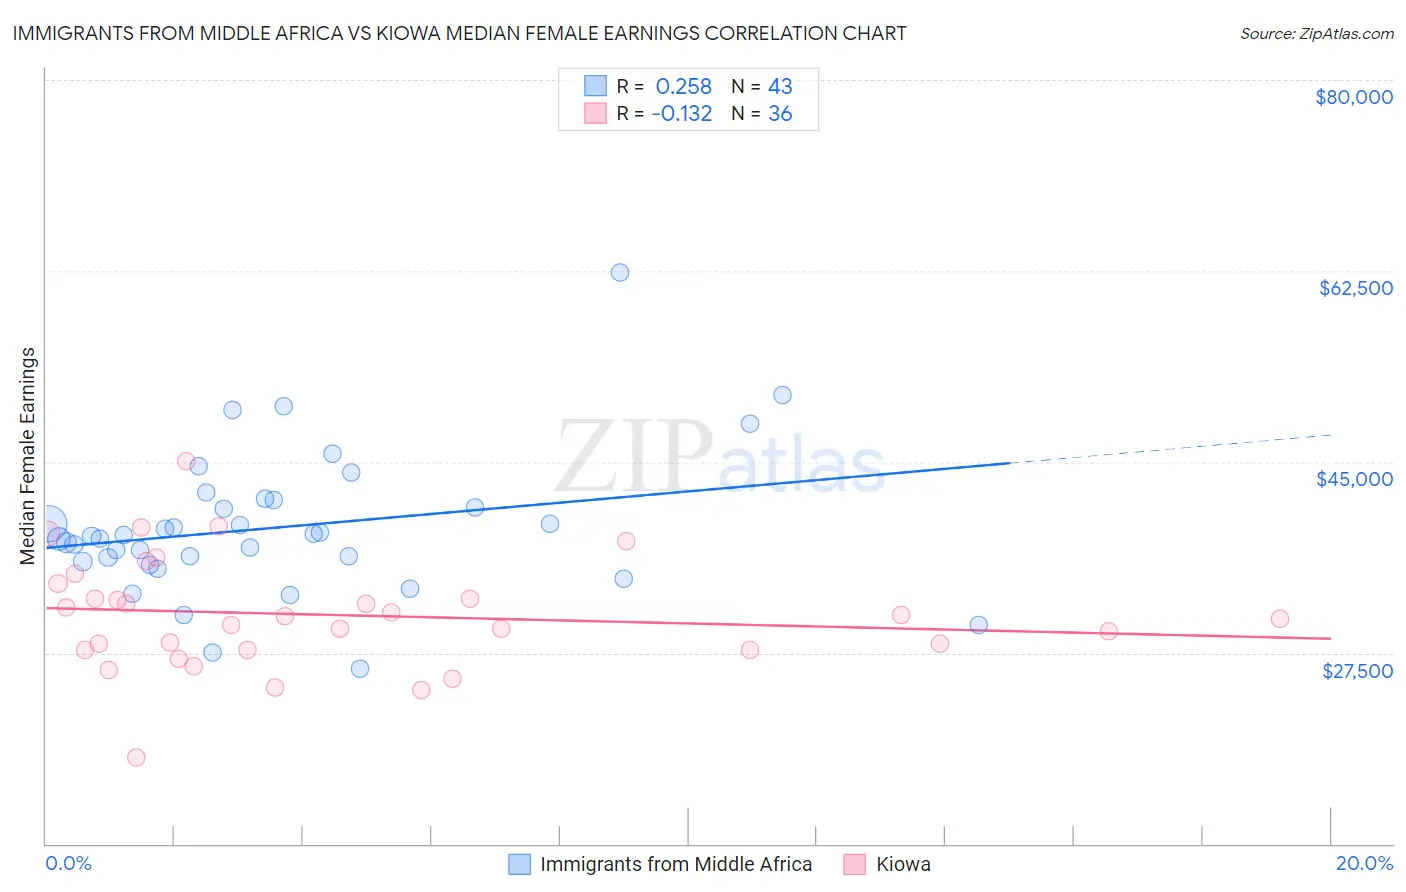
Immigrants from Middle Africa vs Kiowa Median Female Earnings Correlation Chart
The statistical analysis conducted on geographies consisting of 202,702,716 people shows a weak positive correlation between the proportion of Immigrants from Middle Africa and median female earnings in the United States with a correlation coefficient (R) of 0.258 and weighted average of $37,965. Similarly, the statistical analysis conducted on geographies consisting of 56,093,569 people shows a poor negative correlation between the proportion of Kiowa and median female earnings in the United States with a correlation coefficient (R) of -0.132 and weighted average of $34,074, a difference of 11.4%.
Median Female Earnings Correlation Summary
| Measurement | Immigrants from Middle Africa | Kiowa |
| Minimum | $26,014 | $17,933 |
| Maximum | $62,334 | $45,071 |
| Range | $36,320 | $27,137 |
| Mean | $39,010 | $30,965 |
| Median | $38,230 | $30,714 |
| Interquartile 25% (IQ1) | $35,893 | $27,790 |
| Interquartile 75% (IQ3) | $41,514 | $33,181 |
| Interquartile Range (IQR) | $5,621 | $5,391 |
| Standard Deviation (Sample) | $6,561 | $5,151 |
| Standard Deviation (Population) | $6,484 | $5,079 |
Similar Demographics by Median Female Earnings
Demographics Similar to Immigrants from Middle Africa by Median Female Earnings
In terms of median female earnings, the demographic groups most similar to Immigrants from Middle Africa are Delaware ($37,964, a difference of 0.0%), Immigrants from Liberia ($37,970, a difference of 0.010%), German ($37,986, a difference of 0.050%), Immigrants from Somalia ($37,914, a difference of 0.14%), and Alaskan Athabascan ($37,905, a difference of 0.16%).
| Demographics | Rating | Rank | Median Female Earnings |
| Alaska Natives | 4.3 /100 | #238 | Tragic $38,202 |
| English | 4.2 /100 | #239 | Tragic $38,196 |
| Finns | 4.0 /100 | #240 | Tragic $38,173 |
| Spanish | 3.5 /100 | #241 | Tragic $38,098 |
| Immigrants | Burma/Myanmar | 3.0 /100 | #242 | Tragic $38,028 |
| Germans | 2.8 /100 | #243 | Tragic $37,986 |
| Immigrants | Liberia | 2.7 /100 | #244 | Tragic $37,970 |
| Immigrants | Middle Africa | 2.7 /100 | #245 | Tragic $37,965 |
| Delaware | 2.6 /100 | #246 | Tragic $37,964 |
| Immigrants | Somalia | 2.4 /100 | #247 | Tragic $37,914 |
| Alaskan Athabascans | 2.3 /100 | #248 | Tragic $37,905 |
| Swiss | 2.3 /100 | #249 | Tragic $37,904 |
| Immigrants | Iraq | 2.2 /100 | #250 | Tragic $37,864 |
| Welsh | 2.1 /100 | #251 | Tragic $37,856 |
| Immigrants | Dominica | 2.0 /100 | #252 | Tragic $37,825 |
Demographics Similar to Kiowa by Median Female Earnings
In terms of median female earnings, the demographic groups most similar to Kiowa are Dutch West Indian ($34,106, a difference of 0.090%), Cajun ($34,034, a difference of 0.12%), Immigrants from Central America ($33,953, a difference of 0.36%), Hopi ($33,932, a difference of 0.42%), and Menominee ($33,894, a difference of 0.53%).
| Demographics | Rating | Rank | Median Female Earnings |
| Shoshone | 0.0 /100 | #319 | Tragic $34,677 |
| Immigrants | Honduras | 0.0 /100 | #320 | Tragic $34,647 |
| Hispanics or Latinos | 0.0 /100 | #321 | Tragic $34,421 |
| Chickasaw | 0.0 /100 | #322 | Tragic $34,414 |
| Seminole | 0.0 /100 | #323 | Tragic $34,385 |
| Immigrants | Congo | 0.0 /100 | #324 | Tragic $34,317 |
| Dutch West Indians | 0.0 /100 | #325 | Tragic $34,106 |
| Kiowa | 0.0 /100 | #326 | Tragic $34,074 |
| Cajuns | 0.0 /100 | #327 | Tragic $34,034 |
| Immigrants | Central America | 0.0 /100 | #328 | Tragic $33,953 |
| Hopi | 0.0 /100 | #329 | Tragic $33,932 |
| Menominee | 0.0 /100 | #330 | Tragic $33,894 |
| Natives/Alaskans | 0.0 /100 | #331 | Tragic $33,806 |
| Choctaw | 0.0 /100 | #332 | Tragic $33,775 |
| Mexicans | 0.0 /100 | #333 | Tragic $33,664 |