Dutch vs Immigrants from Latvia Householder Income Ages 45 - 64 years
COMPARE
Dutch
Immigrants from Latvia
Householder Income Ages 45 - 64 years
Householder Income Ages 45 - 64 years Comparison
Dutch
Immigrants from Latvia
$99,650
HOUSEHOLDER INCOME AGES 45 - 64 YEARS
41.7/ 100
METRIC RATING
186th/ 347
METRIC RANK
$111,454
HOUSEHOLDER INCOME AGES 45 - 64 YEARS
99.6/ 100
METRIC RATING
64th/ 347
METRIC RANK
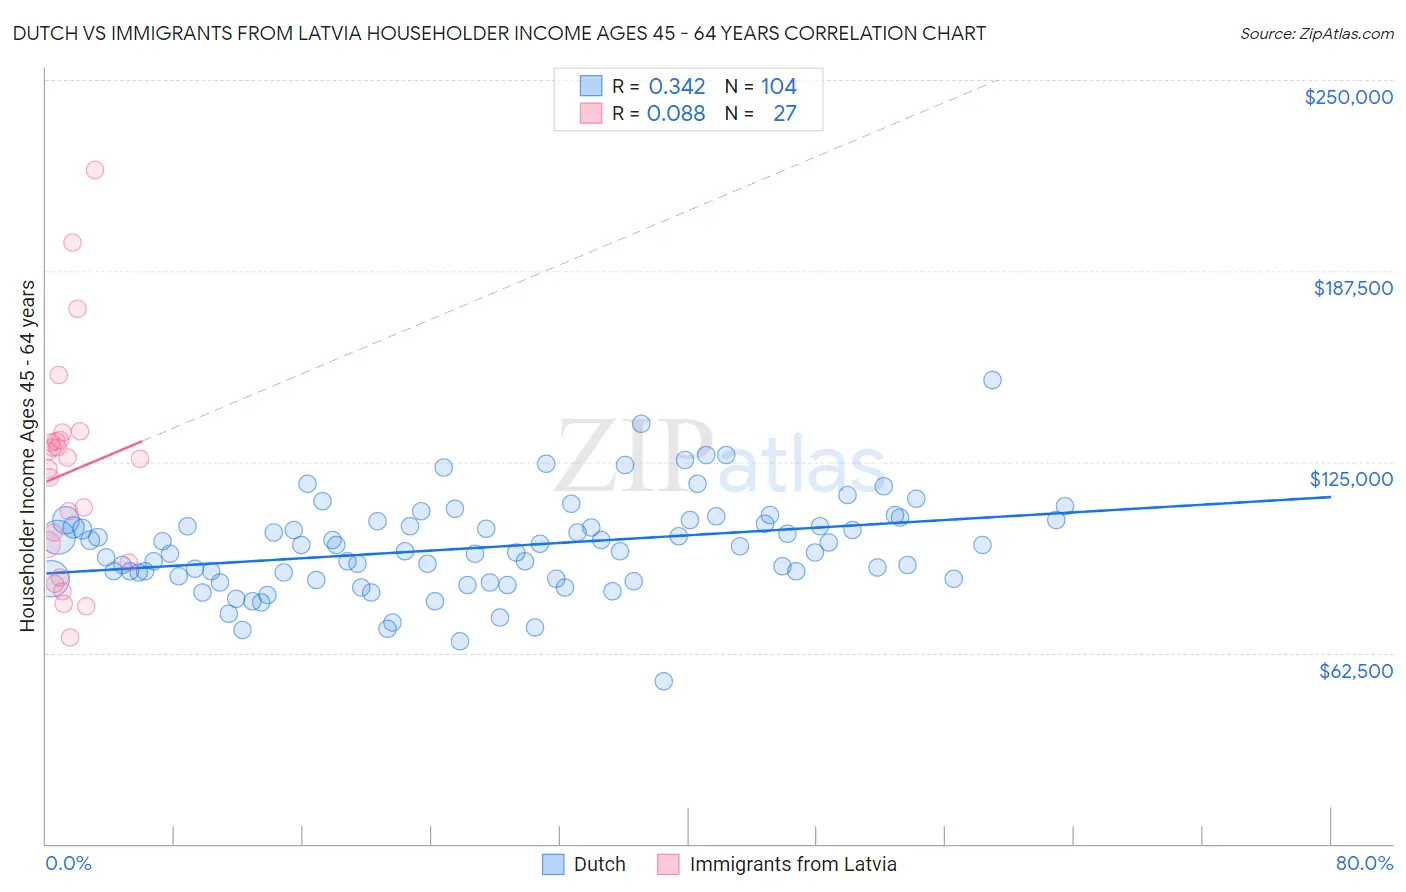
Dutch vs Immigrants from Latvia Householder Income Ages 45 - 64 years Correlation Chart
The statistical analysis conducted on geographies consisting of 551,391,868 people shows a mild positive correlation between the proportion of Dutch and household income with householder between the ages 45 and 64 in the United States with a correlation coefficient (R) of 0.342 and weighted average of $99,650. Similarly, the statistical analysis conducted on geographies consisting of 113,705,895 people shows a slight positive correlation between the proportion of Immigrants from Latvia and household income with householder between the ages 45 and 64 in the United States with a correlation coefficient (R) of 0.088 and weighted average of $111,454, a difference of 11.8%.
Householder Income Ages 45 - 64 years Correlation Summary
| Measurement | Dutch | Immigrants from Latvia |
| Minimum | $53,125 | $67,390 |
| Maximum | $151,830 | $220,625 |
| Range | $98,705 | $153,235 |
| Mean | $96,972 | $121,613 |
| Median | $96,631 | $126,071 |
| Interquartile 25% (IQ1) | $86,774 | $92,091 |
| Interquartile 75% (IQ3) | $104,984 | $132,271 |
| Interquartile Range (IQR) | $18,210 | $40,180 |
| Standard Deviation (Sample) | $15,436 | $35,656 |
| Standard Deviation (Population) | $15,361 | $34,989 |
Similar Demographics by Householder Income Ages 45 - 64 years
Demographics Similar to Dutch by Householder Income Ages 45 - 64 years
In terms of householder income ages 45 - 64 years, the demographic groups most similar to Dutch are Colombian ($99,772, a difference of 0.12%), French ($99,824, a difference of 0.17%), Spaniard ($99,889, a difference of 0.24%), Finnish ($99,904, a difference of 0.25%), and Iraqi ($99,387, a difference of 0.27%).
| Demographics | Rating | Rank | Householder Income Ages 45 - 64 years |
| Belgians | 46.7 /100 | #179 | Average $100,060 |
| Aleuts | 46.6 /100 | #180 | Average $100,052 |
| Immigrants | Immigrants | 45.3 /100 | #181 | Average $99,943 |
| Finns | 44.8 /100 | #182 | Average $99,904 |
| Spaniards | 44.6 /100 | #183 | Average $99,889 |
| French | 43.8 /100 | #184 | Average $99,824 |
| Colombians | 43.2 /100 | #185 | Average $99,772 |
| Dutch | 41.7 /100 | #186 | Average $99,650 |
| Iraqis | 38.5 /100 | #187 | Fair $99,387 |
| Immigrants | Portugal | 36.3 /100 | #188 | Fair $99,203 |
| Immigrants | South America | 35.4 /100 | #189 | Fair $99,126 |
| French Canadians | 35.1 /100 | #190 | Fair $99,093 |
| Kenyans | 33.7 /100 | #191 | Fair $98,970 |
| Celtics | 32.9 /100 | #192 | Fair $98,896 |
| Hawaiians | 31.6 /100 | #193 | Fair $98,778 |
Demographics Similar to Immigrants from Latvia by Householder Income Ages 45 - 64 years
In terms of householder income ages 45 - 64 years, the demographic groups most similar to Immigrants from Latvia are Immigrants from Belarus ($111,430, a difference of 0.020%), Mongolian ($111,602, a difference of 0.13%), New Zealander ($111,286, a difference of 0.15%), Immigrants from Norway ($111,669, a difference of 0.19%), and Laotian ($111,051, a difference of 0.36%).
| Demographics | Rating | Rank | Householder Income Ages 45 - 64 years |
| Immigrants | Scotland | 99.7 /100 | #57 | Exceptional $112,175 |
| Soviet Union | 99.7 /100 | #58 | Exceptional $112,008 |
| Immigrants | Europe | 99.7 /100 | #59 | Exceptional $111,984 |
| Immigrants | Netherlands | 99.7 /100 | #60 | Exceptional $111,982 |
| Immigrants | Czechoslovakia | 99.7 /100 | #61 | Exceptional $111,914 |
| Immigrants | Norway | 99.7 /100 | #62 | Exceptional $111,669 |
| Mongolians | 99.6 /100 | #63 | Exceptional $111,602 |
| Immigrants | Latvia | 99.6 /100 | #64 | Exceptional $111,454 |
| Immigrants | Belarus | 99.6 /100 | #65 | Exceptional $111,430 |
| New Zealanders | 99.6 /100 | #66 | Exceptional $111,286 |
| Laotians | 99.5 /100 | #67 | Exceptional $111,051 |
| Immigrants | Romania | 99.4 /100 | #68 | Exceptional $110,633 |
| Immigrants | Italy | 99.4 /100 | #69 | Exceptional $110,434 |
| Koreans | 99.3 /100 | #70 | Exceptional $110,334 |
| Italians | 99.3 /100 | #71 | Exceptional $110,224 |