Immigrants from Pakistan vs Immigrants from Latvia Householder Income Ages 45 - 64 years
COMPARE
Immigrants from Pakistan
Immigrants from Latvia
Householder Income Ages 45 - 64 years
Householder Income Ages 45 - 64 years Comparison
Immigrants from Pakistan
Immigrants from Latvia
$114,434
HOUSEHOLDER INCOME AGES 45 - 64 YEARS
99.9/ 100
METRIC RATING
38th/ 347
METRIC RANK
$111,454
HOUSEHOLDER INCOME AGES 45 - 64 YEARS
99.6/ 100
METRIC RATING
64th/ 347
METRIC RANK
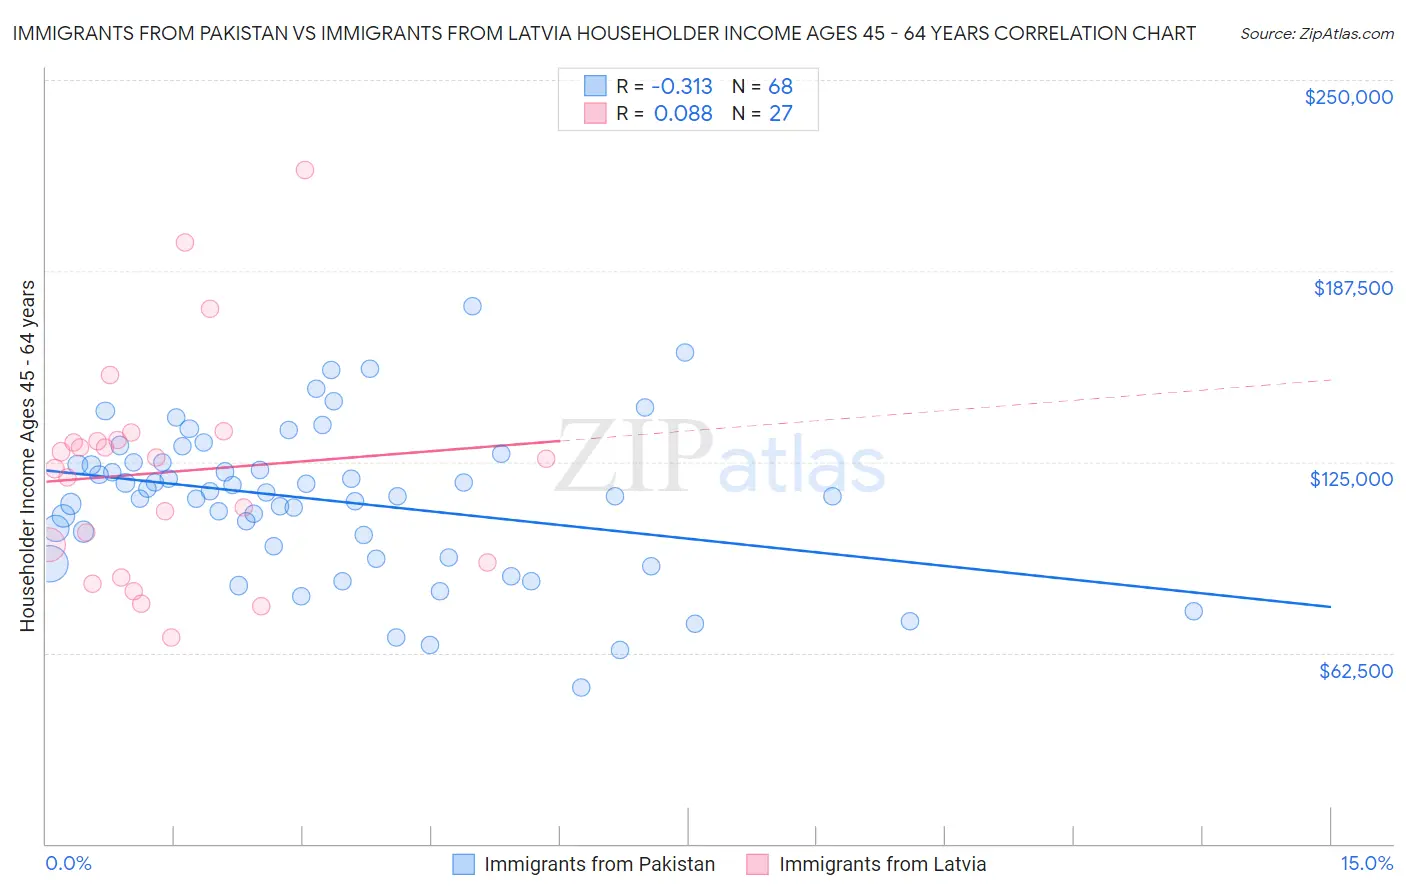
Immigrants from Pakistan vs Immigrants from Latvia Householder Income Ages 45 - 64 years Correlation Chart
The statistical analysis conducted on geographies consisting of 283,615,501 people shows a mild negative correlation between the proportion of Immigrants from Pakistan and household income with householder between the ages 45 and 64 in the United States with a correlation coefficient (R) of -0.313 and weighted average of $114,434. Similarly, the statistical analysis conducted on geographies consisting of 113,705,895 people shows a slight positive correlation between the proportion of Immigrants from Latvia and household income with householder between the ages 45 and 64 in the United States with a correlation coefficient (R) of 0.088 and weighted average of $111,454, a difference of 2.7%.
Householder Income Ages 45 - 64 years Correlation Summary
| Measurement | Immigrants from Pakistan | Immigrants from Latvia |
| Minimum | $51,094 | $67,390 |
| Maximum | $175,934 | $220,625 |
| Range | $124,840 | $153,235 |
| Mean | $112,409 | $121,613 |
| Median | $114,510 | $126,071 |
| Interquartile 25% (IQ1) | $95,569 | $92,091 |
| Interquartile 75% (IQ3) | $124,922 | $132,271 |
| Interquartile Range (IQR) | $29,353 | $40,180 |
| Standard Deviation (Sample) | $24,730 | $35,656 |
| Standard Deviation (Population) | $24,548 | $34,989 |
Similar Demographics by Householder Income Ages 45 - 64 years
Demographics Similar to Immigrants from Pakistan by Householder Income Ages 45 - 64 years
In terms of householder income ages 45 - 64 years, the demographic groups most similar to Immigrants from Pakistan are Immigrants from Turkey ($114,407, a difference of 0.020%), Cambodian ($114,342, a difference of 0.080%), Immigrants from Lithuania ($114,336, a difference of 0.090%), Estonian ($114,220, a difference of 0.19%), and Israeli ($114,186, a difference of 0.22%).
| Demographics | Rating | Rank | Householder Income Ages 45 - 64 years |
| Immigrants | Asia | 100.0 /100 | #31 | Exceptional $116,566 |
| Russians | 100.0 /100 | #32 | Exceptional $116,328 |
| Chinese | 100.0 /100 | #33 | Exceptional $116,156 |
| Immigrants | Denmark | 100.0 /100 | #34 | Exceptional $116,000 |
| Latvians | 100.0 /100 | #35 | Exceptional $115,957 |
| Immigrants | Switzerland | 100.0 /100 | #36 | Exceptional $115,934 |
| Maltese | 99.9 /100 | #37 | Exceptional $114,754 |
| Immigrants | Pakistan | 99.9 /100 | #38 | Exceptional $114,434 |
| Immigrants | Turkey | 99.9 /100 | #39 | Exceptional $114,407 |
| Cambodians | 99.9 /100 | #40 | Exceptional $114,342 |
| Immigrants | Lithuania | 99.9 /100 | #41 | Exceptional $114,336 |
| Estonians | 99.9 /100 | #42 | Exceptional $114,220 |
| Israelis | 99.9 /100 | #43 | Exceptional $114,186 |
| Bulgarians | 99.9 /100 | #44 | Exceptional $113,883 |
| Immigrants | France | 99.9 /100 | #45 | Exceptional $113,680 |
Demographics Similar to Immigrants from Latvia by Householder Income Ages 45 - 64 years
In terms of householder income ages 45 - 64 years, the demographic groups most similar to Immigrants from Latvia are Immigrants from Belarus ($111,430, a difference of 0.020%), Mongolian ($111,602, a difference of 0.13%), New Zealander ($111,286, a difference of 0.15%), Immigrants from Norway ($111,669, a difference of 0.19%), and Laotian ($111,051, a difference of 0.36%).
| Demographics | Rating | Rank | Householder Income Ages 45 - 64 years |
| Immigrants | Scotland | 99.7 /100 | #57 | Exceptional $112,175 |
| Soviet Union | 99.7 /100 | #58 | Exceptional $112,008 |
| Immigrants | Europe | 99.7 /100 | #59 | Exceptional $111,984 |
| Immigrants | Netherlands | 99.7 /100 | #60 | Exceptional $111,982 |
| Immigrants | Czechoslovakia | 99.7 /100 | #61 | Exceptional $111,914 |
| Immigrants | Norway | 99.7 /100 | #62 | Exceptional $111,669 |
| Mongolians | 99.6 /100 | #63 | Exceptional $111,602 |
| Immigrants | Latvia | 99.6 /100 | #64 | Exceptional $111,454 |
| Immigrants | Belarus | 99.6 /100 | #65 | Exceptional $111,430 |
| New Zealanders | 99.6 /100 | #66 | Exceptional $111,286 |
| Laotians | 99.5 /100 | #67 | Exceptional $111,051 |
| Immigrants | Romania | 99.4 /100 | #68 | Exceptional $110,633 |
| Immigrants | Italy | 99.4 /100 | #69 | Exceptional $110,434 |
| Koreans | 99.3 /100 | #70 | Exceptional $110,334 |
| Italians | 99.3 /100 | #71 | Exceptional $110,224 |