Immigrants from North America vs Immigrants from Latvia Householder Income Ages 45 - 64 years
COMPARE
Immigrants from North America
Immigrants from Latvia
Householder Income Ages 45 - 64 years
Householder Income Ages 45 - 64 years Comparison
Immigrants from North America
Immigrants from Latvia
$109,198
HOUSEHOLDER INCOME AGES 45 - 64 YEARS
98.8/ 100
METRIC RATING
82nd/ 347
METRIC RANK
$111,454
HOUSEHOLDER INCOME AGES 45 - 64 YEARS
99.6/ 100
METRIC RATING
64th/ 347
METRIC RANK
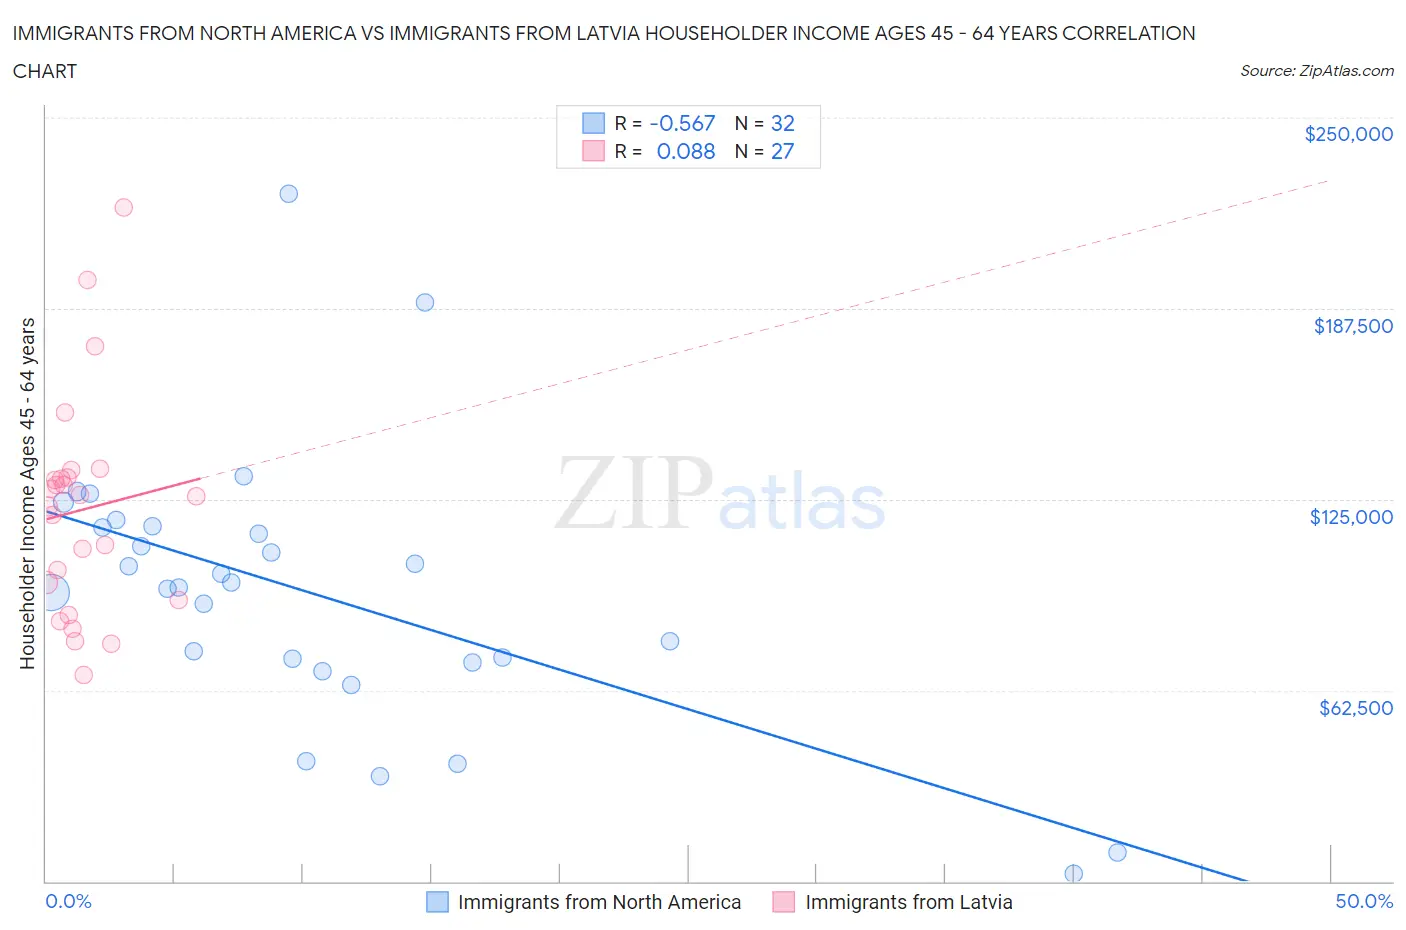
Immigrants from North America vs Immigrants from Latvia Householder Income Ages 45 - 64 years Correlation Chart
The statistical analysis conducted on geographies consisting of 461,409,956 people shows a substantial negative correlation between the proportion of Immigrants from North America and household income with householder between the ages 45 and 64 in the United States with a correlation coefficient (R) of -0.567 and weighted average of $109,198. Similarly, the statistical analysis conducted on geographies consisting of 113,705,895 people shows a slight positive correlation between the proportion of Immigrants from Latvia and household income with householder between the ages 45 and 64 in the United States with a correlation coefficient (R) of 0.088 and weighted average of $111,454, a difference of 2.1%.
Householder Income Ages 45 - 64 years Correlation Summary
| Measurement | Immigrants from North America | Immigrants from Latvia |
| Minimum | $2,499 | $67,390 |
| Maximum | $225,000 | $220,625 |
| Range | $222,501 | $153,235 |
| Mean | $94,322 | $121,613 |
| Median | $96,912 | $126,071 |
| Interquartile 25% (IQ1) | $72,197 | $92,091 |
| Interquartile 75% (IQ3) | $115,910 | $132,271 |
| Interquartile Range (IQR) | $43,714 | $40,180 |
| Standard Deviation (Sample) | $44,789 | $35,656 |
| Standard Deviation (Population) | $44,084 | $34,989 |
Demographics Similar to Immigrants from North America and Immigrants from Latvia by Householder Income Ages 45 - 64 years
In terms of householder income ages 45 - 64 years, the demographic groups most similar to Immigrants from North America are Immigrants from Eastern Europe ($109,335, a difference of 0.12%), Immigrants from Spain ($109,051, a difference of 0.14%), Jordanian ($109,376, a difference of 0.16%), Immigrants from Bulgaria ($109,379, a difference of 0.17%), and Immigrants from Canada ($109,402, a difference of 0.19%). Similarly, the demographic groups most similar to Immigrants from Latvia are Immigrants from Belarus ($111,430, a difference of 0.020%), Mongolian ($111,602, a difference of 0.13%), New Zealander ($111,286, a difference of 0.15%), Laotian ($111,051, a difference of 0.36%), and Immigrants from Romania ($110,633, a difference of 0.74%).
| Demographics | Rating | Rank | Householder Income Ages 45 - 64 years |
| Mongolians | 99.6 /100 | #63 | Exceptional $111,602 |
| Immigrants | Latvia | 99.6 /100 | #64 | Exceptional $111,454 |
| Immigrants | Belarus | 99.6 /100 | #65 | Exceptional $111,430 |
| New Zealanders | 99.6 /100 | #66 | Exceptional $111,286 |
| Laotians | 99.5 /100 | #67 | Exceptional $111,051 |
| Immigrants | Romania | 99.4 /100 | #68 | Exceptional $110,633 |
| Immigrants | Italy | 99.4 /100 | #69 | Exceptional $110,434 |
| Koreans | 99.3 /100 | #70 | Exceptional $110,334 |
| Italians | 99.3 /100 | #71 | Exceptional $110,224 |
| Assyrians/Chaldeans/Syriacs | 99.3 /100 | #72 | Exceptional $110,201 |
| Argentineans | 99.3 /100 | #73 | Exceptional $110,103 |
| Immigrants | Egypt | 99.2 /100 | #74 | Exceptional $109,941 |
| South Africans | 99.1 /100 | #75 | Exceptional $109,719 |
| Paraguayans | 99.0 /100 | #76 | Exceptional $109,447 |
| Immigrants | England | 99.0 /100 | #77 | Exceptional $109,446 |
| Immigrants | Canada | 99.0 /100 | #78 | Exceptional $109,402 |
| Immigrants | Bulgaria | 98.9 /100 | #79 | Exceptional $109,379 |
| Jordanians | 98.9 /100 | #80 | Exceptional $109,376 |
| Immigrants | Eastern Europe | 98.9 /100 | #81 | Exceptional $109,335 |
| Immigrants | North America | 98.8 /100 | #82 | Exceptional $109,198 |
| Immigrants | Spain | 98.8 /100 | #83 | Exceptional $109,051 |