Dutch vs Israeli Householder Income Ages 45 - 64 years
COMPARE
Dutch
Israeli
Householder Income Ages 45 - 64 years
Householder Income Ages 45 - 64 years Comparison
Dutch
Israelis
$99,650
HOUSEHOLDER INCOME AGES 45 - 64 YEARS
41.7/ 100
METRIC RATING
186th/ 347
METRIC RANK
$114,186
HOUSEHOLDER INCOME AGES 45 - 64 YEARS
99.9/ 100
METRIC RATING
43rd/ 347
METRIC RANK
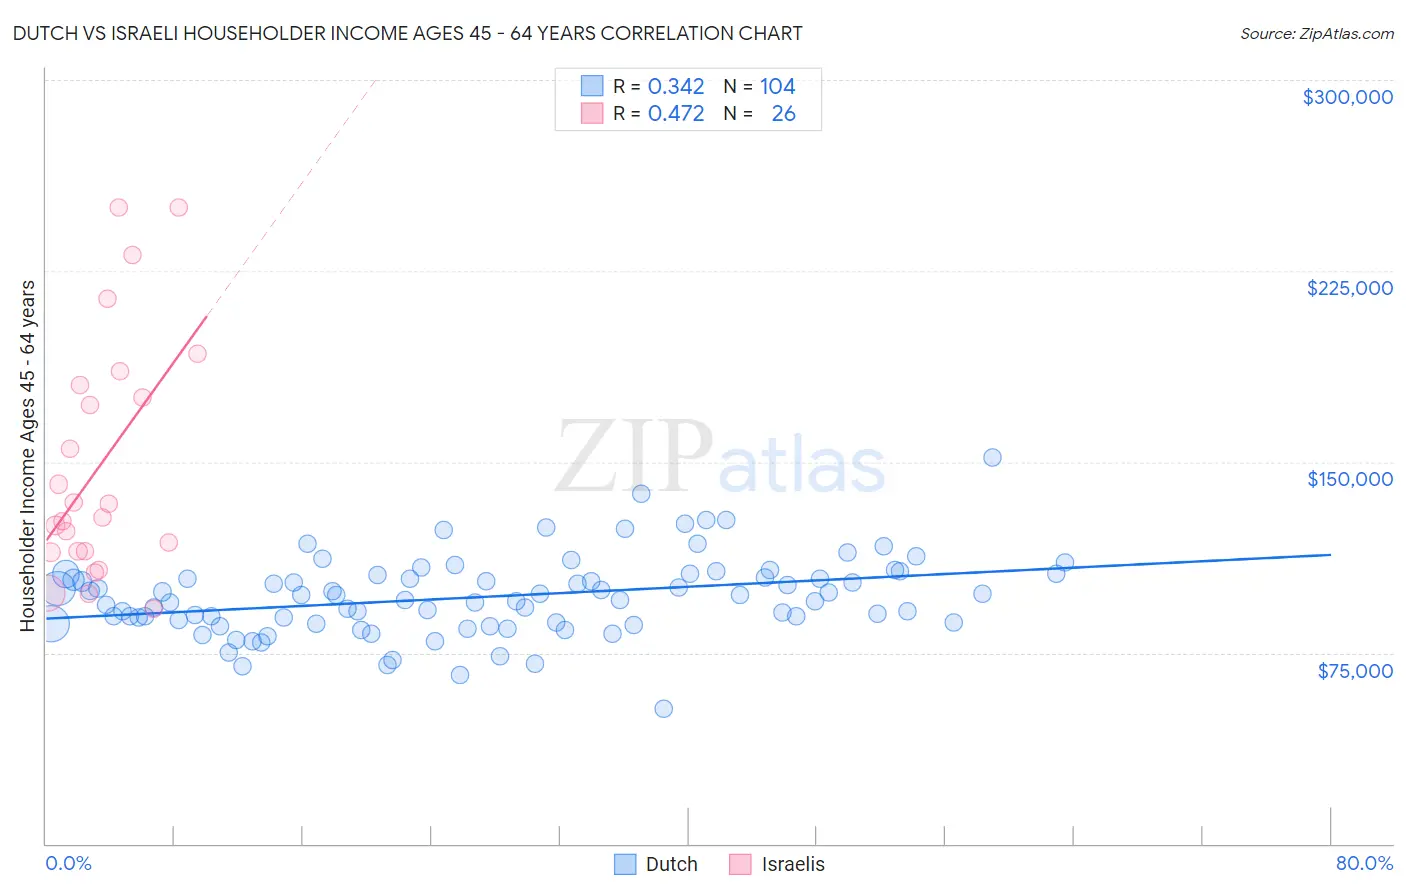
Dutch vs Israeli Householder Income Ages 45 - 64 years Correlation Chart
The statistical analysis conducted on geographies consisting of 551,391,868 people shows a mild positive correlation between the proportion of Dutch and household income with householder between the ages 45 and 64 in the United States with a correlation coefficient (R) of 0.342 and weighted average of $99,650. Similarly, the statistical analysis conducted on geographies consisting of 210,810,721 people shows a moderate positive correlation between the proportion of Israelis and household income with householder between the ages 45 and 64 in the United States with a correlation coefficient (R) of 0.472 and weighted average of $114,186, a difference of 14.6%.
Householder Income Ages 45 - 64 years Correlation Summary
| Measurement | Dutch | Israeli |
| Minimum | $53,125 | $92,288 |
| Maximum | $151,830 | $250,001 |
| Range | $98,705 | $157,713 |
| Mean | $96,972 | $149,359 |
| Median | $96,631 | $130,987 |
| Interquartile 25% (IQ1) | $86,774 | $114,835 |
| Interquartile 75% (IQ3) | $104,984 | $180,235 |
| Interquartile Range (IQR) | $18,210 | $65,400 |
| Standard Deviation (Sample) | $15,436 | $47,309 |
| Standard Deviation (Population) | $15,361 | $46,390 |
Similar Demographics by Householder Income Ages 45 - 64 years
Demographics Similar to Dutch by Householder Income Ages 45 - 64 years
In terms of householder income ages 45 - 64 years, the demographic groups most similar to Dutch are Colombian ($99,772, a difference of 0.12%), French ($99,824, a difference of 0.17%), Spaniard ($99,889, a difference of 0.24%), Finnish ($99,904, a difference of 0.25%), and Iraqi ($99,387, a difference of 0.27%).
| Demographics | Rating | Rank | Householder Income Ages 45 - 64 years |
| Belgians | 46.7 /100 | #179 | Average $100,060 |
| Aleuts | 46.6 /100 | #180 | Average $100,052 |
| Immigrants | Immigrants | 45.3 /100 | #181 | Average $99,943 |
| Finns | 44.8 /100 | #182 | Average $99,904 |
| Spaniards | 44.6 /100 | #183 | Average $99,889 |
| French | 43.8 /100 | #184 | Average $99,824 |
| Colombians | 43.2 /100 | #185 | Average $99,772 |
| Dutch | 41.7 /100 | #186 | Average $99,650 |
| Iraqis | 38.5 /100 | #187 | Fair $99,387 |
| Immigrants | Portugal | 36.3 /100 | #188 | Fair $99,203 |
| Immigrants | South America | 35.4 /100 | #189 | Fair $99,126 |
| French Canadians | 35.1 /100 | #190 | Fair $99,093 |
| Kenyans | 33.7 /100 | #191 | Fair $98,970 |
| Celtics | 32.9 /100 | #192 | Fair $98,896 |
| Hawaiians | 31.6 /100 | #193 | Fair $98,778 |
Demographics Similar to Israelis by Householder Income Ages 45 - 64 years
In terms of householder income ages 45 - 64 years, the demographic groups most similar to Israelis are Estonian ($114,220, a difference of 0.030%), Immigrants from Lithuania ($114,336, a difference of 0.13%), Cambodian ($114,342, a difference of 0.14%), Immigrants from Turkey ($114,407, a difference of 0.19%), and Immigrants from Pakistan ($114,434, a difference of 0.22%).
| Demographics | Rating | Rank | Householder Income Ages 45 - 64 years |
| Immigrants | Switzerland | 100.0 /100 | #36 | Exceptional $115,934 |
| Maltese | 99.9 /100 | #37 | Exceptional $114,754 |
| Immigrants | Pakistan | 99.9 /100 | #38 | Exceptional $114,434 |
| Immigrants | Turkey | 99.9 /100 | #39 | Exceptional $114,407 |
| Cambodians | 99.9 /100 | #40 | Exceptional $114,342 |
| Immigrants | Lithuania | 99.9 /100 | #41 | Exceptional $114,336 |
| Estonians | 99.9 /100 | #42 | Exceptional $114,220 |
| Israelis | 99.9 /100 | #43 | Exceptional $114,186 |
| Bulgarians | 99.9 /100 | #44 | Exceptional $113,883 |
| Immigrants | France | 99.9 /100 | #45 | Exceptional $113,680 |
| Immigrants | Greece | 99.9 /100 | #46 | Exceptional $113,548 |
| Australians | 99.9 /100 | #47 | Exceptional $113,533 |
| Immigrants | Indonesia | 99.9 /100 | #48 | Exceptional $113,519 |
| Immigrants | Russia | 99.8 /100 | #49 | Exceptional $113,215 |
| Immigrants | Austria | 99.8 /100 | #50 | Exceptional $113,140 |