Immigrants from Cuba vs Immigrants from Fiji Median Household Income
COMPARE
Immigrants from Cuba
Immigrants from Fiji
Median Household Income
Median Household Income Comparison
Immigrants from Cuba
Immigrants from Fiji
$68,461
MEDIAN HOUSEHOLD INCOME
0.0/ 100
METRIC RATING
327th/ 347
METRIC RANK
$93,933
MEDIAN HOUSEHOLD INCOME
99.7/ 100
METRIC RATING
70th/ 347
METRIC RANK
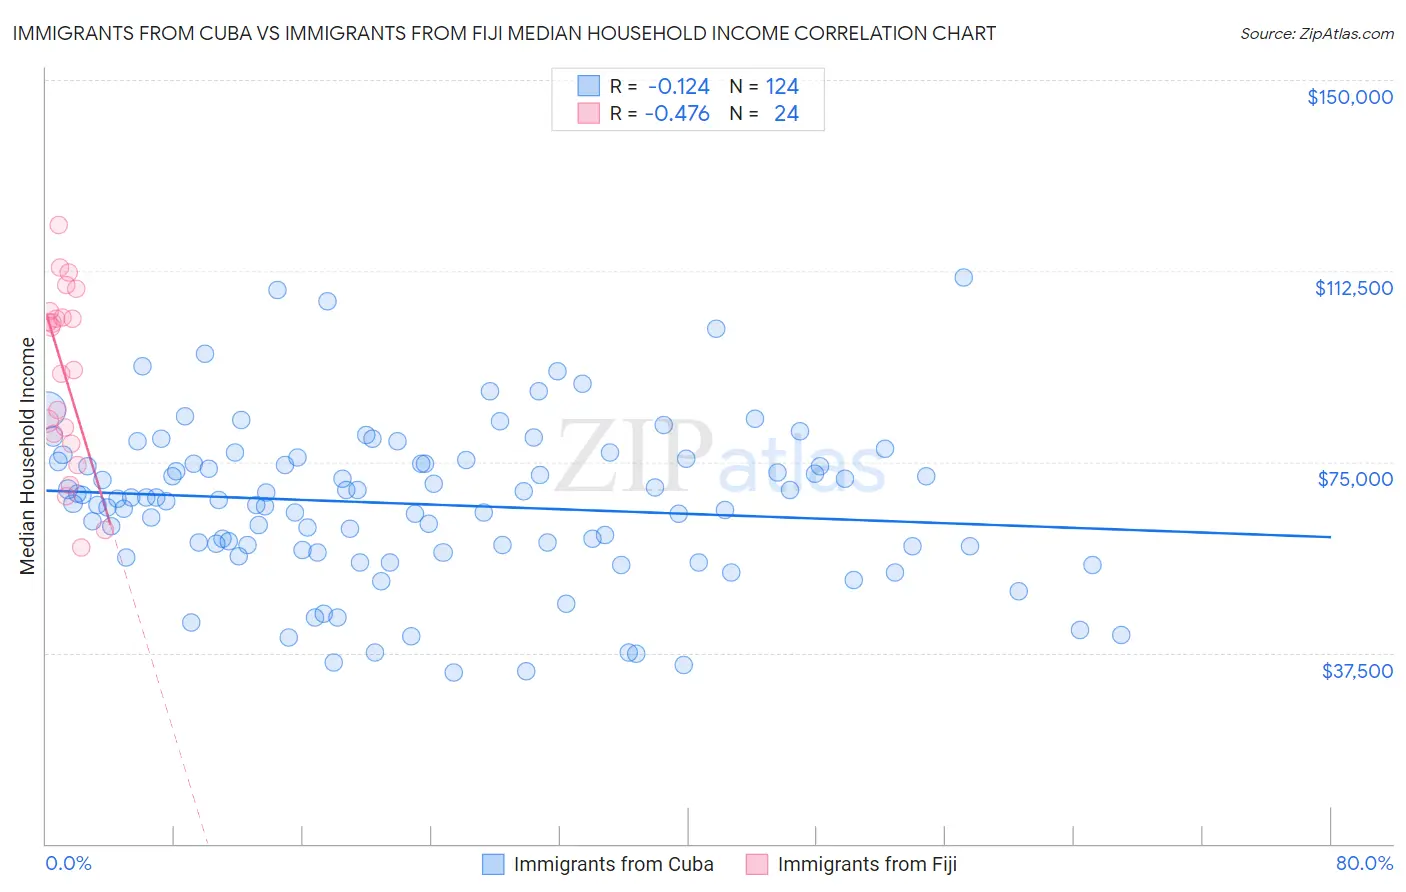
Immigrants from Cuba vs Immigrants from Fiji Median Household Income Correlation Chart
The statistical analysis conducted on geographies consisting of 325,902,946 people shows a poor negative correlation between the proportion of Immigrants from Cuba and median household income in the United States with a correlation coefficient (R) of -0.124 and weighted average of $68,461. Similarly, the statistical analysis conducted on geographies consisting of 93,754,169 people shows a moderate negative correlation between the proportion of Immigrants from Fiji and median household income in the United States with a correlation coefficient (R) of -0.476 and weighted average of $93,933, a difference of 37.2%.
Median Household Income Correlation Summary
| Measurement | Immigrants from Cuba | Immigrants from Fiji |
| Minimum | $33,697 | $58,122 |
| Maximum | $111,328 | $121,408 |
| Range | $77,631 | $63,286 |
| Mean | $66,701 | $92,206 |
| Median | $67,566 | $97,285 |
| Interquartile 25% (IQ1) | $57,982 | $79,580 |
| Interquartile 75% (IQ3) | $75,238 | $103,956 |
| Interquartile Range (IQR) | $17,257 | $24,377 |
| Standard Deviation (Sample) | $15,525 | $17,579 |
| Standard Deviation (Population) | $15,462 | $17,209 |
Similar Demographics by Median Household Income
Demographics Similar to Immigrants from Cuba by Median Household Income
In terms of median household income, the demographic groups most similar to Immigrants from Cuba are Menominee ($68,423, a difference of 0.060%), Dutch West Indian ($68,412, a difference of 0.070%), Yuman ($68,743, a difference of 0.41%), Arapaho ($67,965, a difference of 0.73%), and Native/Alaskan ($67,879, a difference of 0.86%).
| Demographics | Rating | Rank | Median Household Income |
| Colville | 0.0 /100 | #320 | Tragic $70,094 |
| Chickasaw | 0.0 /100 | #321 | Tragic $70,005 |
| Choctaw | 0.0 /100 | #322 | Tragic $69,947 |
| Bahamians | 0.0 /100 | #323 | Tragic $69,726 |
| Yup'ik | 0.0 /100 | #324 | Tragic $69,695 |
| Seminole | 0.0 /100 | #325 | Tragic $69,420 |
| Yuman | 0.0 /100 | #326 | Tragic $68,743 |
| Immigrants | Cuba | 0.0 /100 | #327 | Tragic $68,461 |
| Menominee | 0.0 /100 | #328 | Tragic $68,423 |
| Dutch West Indians | 0.0 /100 | #329 | Tragic $68,412 |
| Arapaho | 0.0 /100 | #330 | Tragic $67,965 |
| Natives/Alaskans | 0.0 /100 | #331 | Tragic $67,879 |
| Sioux | 0.0 /100 | #332 | Tragic $67,792 |
| Creek | 0.0 /100 | #333 | Tragic $67,715 |
| Blacks/African Americans | 0.0 /100 | #334 | Tragic $67,573 |
Demographics Similar to Immigrants from Fiji by Median Household Income
In terms of median household income, the demographic groups most similar to Immigrants from Fiji are Argentinean ($93,960, a difference of 0.030%), Mongolian ($93,971, a difference of 0.040%), Immigrants from Philippines ($93,899, a difference of 0.040%), Lithuanian ($93,852, a difference of 0.090%), and Immigrants from Scotland ($94,091, a difference of 0.17%).
| Demographics | Rating | Rank | Median Household Income |
| Greeks | 99.8 /100 | #63 | Exceptional $94,735 |
| Immigrants | Netherlands | 99.7 /100 | #64 | Exceptional $94,411 |
| Immigrants | Belarus | 99.7 /100 | #65 | Exceptional $94,399 |
| Immigrants | Romania | 99.7 /100 | #66 | Exceptional $94,222 |
| Immigrants | Scotland | 99.7 /100 | #67 | Exceptional $94,091 |
| Mongolians | 99.7 /100 | #68 | Exceptional $93,971 |
| Argentineans | 99.7 /100 | #69 | Exceptional $93,960 |
| Immigrants | Fiji | 99.7 /100 | #70 | Exceptional $93,933 |
| Immigrants | Philippines | 99.6 /100 | #71 | Exceptional $93,899 |
| Lithuanians | 99.6 /100 | #72 | Exceptional $93,852 |
| Immigrants | Egypt | 99.6 /100 | #73 | Exceptional $93,700 |
| Immigrants | Latvia | 99.6 /100 | #74 | Exceptional $93,602 |
| Immigrants | Italy | 99.5 /100 | #75 | Exceptional $93,465 |
| South Africans | 99.5 /100 | #76 | Exceptional $93,379 |
| Immigrants | Afghanistan | 99.5 /100 | #77 | Exceptional $93,375 |