Dutch vs Spaniard Householder Income Under 25 years
COMPARE
Dutch
Spaniard
Householder Income Under 25 years
Householder Income Under 25 years Comparison
Dutch
Spaniards
$51,265
HOUSEHOLDER INCOME UNDER 25 YEARS
9.4/ 100
METRIC RATING
213th/ 347
METRIC RANK
$51,117
HOUSEHOLDER INCOME UNDER 25 YEARS
6.8/ 100
METRIC RATING
222nd/ 347
METRIC RANK
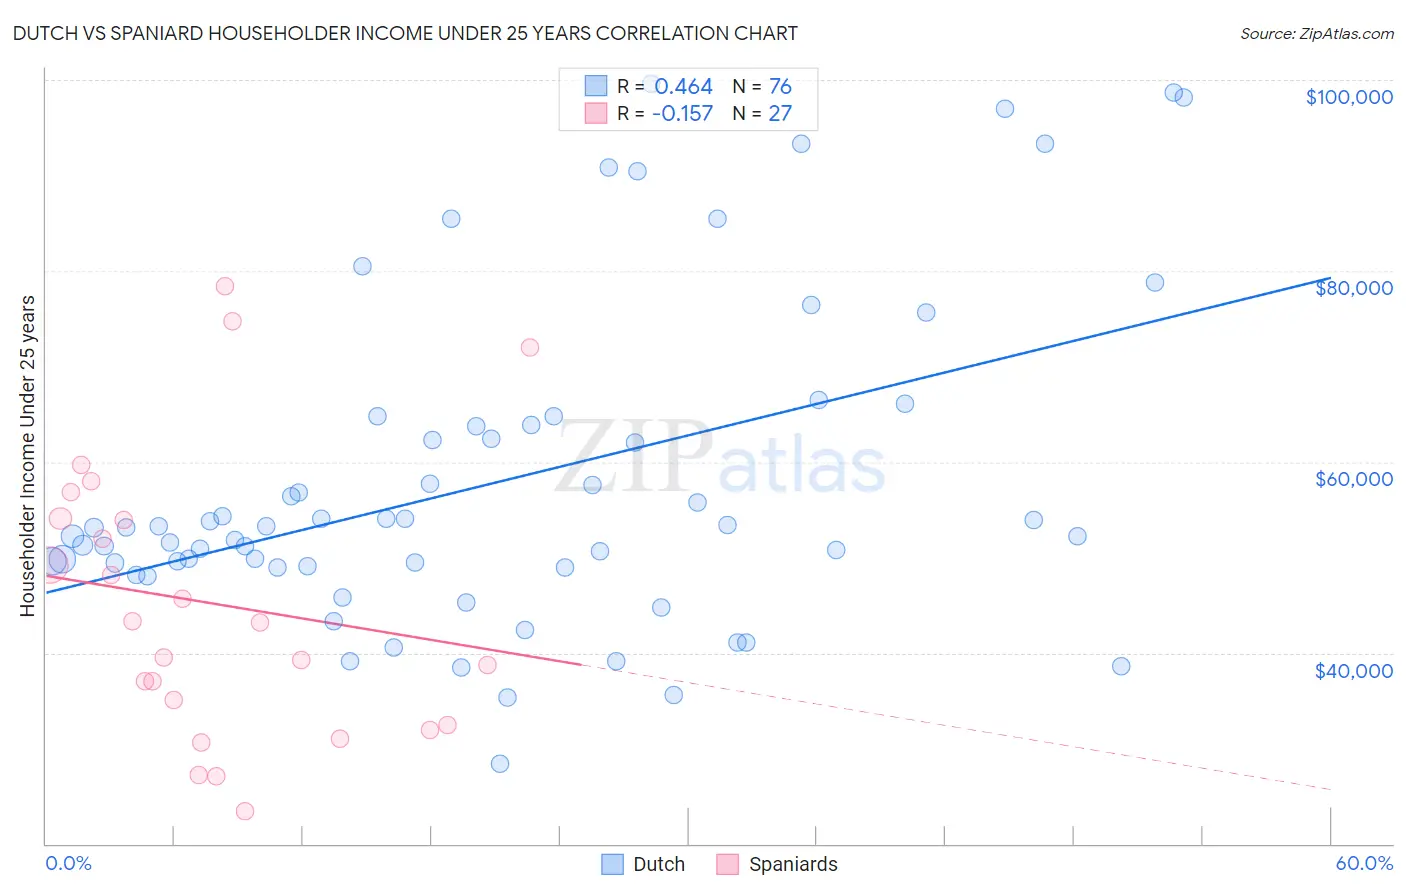
Dutch vs Spaniard Householder Income Under 25 years Correlation Chart
The statistical analysis conducted on geographies consisting of 431,004,830 people shows a moderate positive correlation between the proportion of Dutch and household income with householder under the age of 25 in the United States with a correlation coefficient (R) of 0.464 and weighted average of $51,265. Similarly, the statistical analysis conducted on geographies consisting of 367,865,283 people shows a poor negative correlation between the proportion of Spaniards and household income with householder under the age of 25 in the United States with a correlation coefficient (R) of -0.157 and weighted average of $51,117, a difference of 0.29%.
Householder Income Under 25 years Correlation Summary
| Measurement | Dutch | Spaniard |
| Minimum | $28,378 | $23,340 |
| Maximum | $99,620 | $78,408 |
| Range | $71,242 | $55,068 |
| Mean | $57,868 | $45,152 |
| Median | $53,119 | $43,152 |
| Interquartile 25% (IQ1) | $49,046 | $32,500 |
| Interquartile 75% (IQ3) | $63,833 | $54,035 |
| Interquartile Range (IQR) | $14,787 | $21,535 |
| Standard Deviation (Sample) | $16,885 | $14,752 |
| Standard Deviation (Population) | $16,773 | $14,476 |
Demographics Similar to Dutch and Spaniards by Householder Income Under 25 years
In terms of householder income under 25 years, the demographic groups most similar to Dutch are Zimbabwean ($51,259, a difference of 0.010%), Immigrants from Panama ($51,278, a difference of 0.030%), Icelander ($51,247, a difference of 0.030%), French ($51,230, a difference of 0.070%), and Czechoslovakian ($51,224, a difference of 0.080%). Similarly, the demographic groups most similar to Spaniards are Serbian ($51,106, a difference of 0.020%), Belizean ($51,094, a difference of 0.050%), Immigrants from Eastern Africa ($51,158, a difference of 0.080%), Immigrants from Germany ($51,190, a difference of 0.14%), and Immigrants from Jamaica ($51,038, a difference of 0.16%).
| Demographics | Rating | Rank | Householder Income Under 25 years |
| South Africans | 12.2 /100 | #207 | Poor $51,383 |
| Immigrants | Jordan | 11.9 /100 | #208 | Poor $51,370 |
| Syrians | 11.4 /100 | #209 | Poor $51,353 |
| Immigrants | Ghana | 10.9 /100 | #210 | Poor $51,333 |
| Irish | 10.6 /100 | #211 | Poor $51,317 |
| Immigrants | Panama | 9.7 /100 | #212 | Tragic $51,278 |
| Dutch | 9.4 /100 | #213 | Tragic $51,265 |
| Zimbabweans | 9.3 /100 | #214 | Tragic $51,259 |
| Icelanders | 9.1 /100 | #215 | Tragic $51,247 |
| French | 8.7 /100 | #216 | Tragic $51,230 |
| Czechoslovakians | 8.6 /100 | #217 | Tragic $51,224 |
| Immigrants | Belize | 8.6 /100 | #218 | Tragic $51,223 |
| Arabs | 8.5 /100 | #219 | Tragic $51,219 |
| Immigrants | Germany | 8.0 /100 | #220 | Tragic $51,190 |
| Immigrants | Eastern Africa | 7.4 /100 | #221 | Tragic $51,158 |
| Spaniards | 6.8 /100 | #222 | Tragic $51,117 |
| Serbians | 6.6 /100 | #223 | Tragic $51,106 |
| Belizeans | 6.4 /100 | #224 | Tragic $51,094 |
| Immigrants | Jamaica | 5.6 /100 | #225 | Tragic $51,038 |
| Yugoslavians | 5.5 /100 | #226 | Tragic $51,028 |
| Immigrants | Central America | 5.4 /100 | #227 | Tragic $51,022 |