Dutch vs Chinese Householder Income Under 25 years
COMPARE
Dutch
Chinese
Householder Income Under 25 years
Householder Income Under 25 years Comparison
Dutch
Chinese
$51,265
HOUSEHOLDER INCOME UNDER 25 YEARS
9.4/ 100
METRIC RATING
213th/ 347
METRIC RANK
$58,162
HOUSEHOLDER INCOME UNDER 25 YEARS
100.0/ 100
METRIC RATING
9th/ 347
METRIC RANK
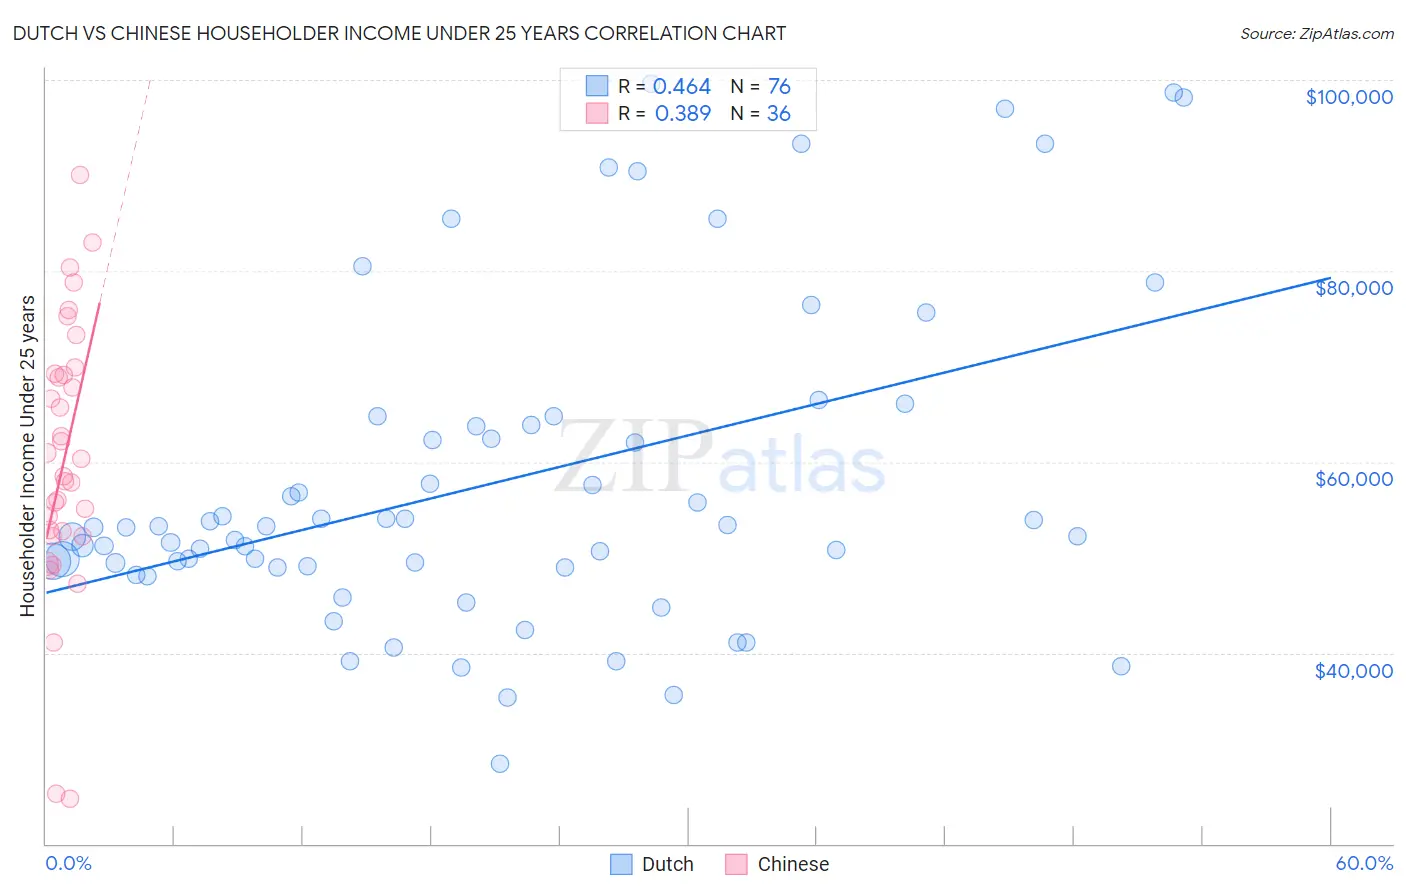
Dutch vs Chinese Householder Income Under 25 years Correlation Chart
The statistical analysis conducted on geographies consisting of 431,004,830 people shows a moderate positive correlation between the proportion of Dutch and household income with householder under the age of 25 in the United States with a correlation coefficient (R) of 0.464 and weighted average of $51,265. Similarly, the statistical analysis conducted on geographies consisting of 61,331,136 people shows a mild positive correlation between the proportion of Chinese and household income with householder under the age of 25 in the United States with a correlation coefficient (R) of 0.389 and weighted average of $58,162, a difference of 13.5%.
Householder Income Under 25 years Correlation Summary
| Measurement | Dutch | Chinese |
| Minimum | $28,378 | $24,709 |
| Maximum | $99,620 | $90,052 |
| Range | $71,242 | $65,343 |
| Mean | $57,868 | $60,302 |
| Median | $53,119 | $59,375 |
| Interquartile 25% (IQ1) | $49,046 | $52,464 |
| Interquartile 75% (IQ3) | $63,833 | $69,171 |
| Interquartile Range (IQR) | $14,787 | $16,707 |
| Standard Deviation (Sample) | $16,885 | $14,147 |
| Standard Deviation (Population) | $16,773 | $13,949 |
Similar Demographics by Householder Income Under 25 years
Demographics Similar to Dutch by Householder Income Under 25 years
In terms of householder income under 25 years, the demographic groups most similar to Dutch are Zimbabwean ($51,259, a difference of 0.010%), Immigrants from Panama ($51,278, a difference of 0.030%), Icelander ($51,247, a difference of 0.030%), French ($51,230, a difference of 0.070%), and Czechoslovakian ($51,224, a difference of 0.080%).
| Demographics | Rating | Rank | Householder Income Under 25 years |
| Immigrants | Latin America | 12.3 /100 | #206 | Poor $51,387 |
| South Africans | 12.2 /100 | #207 | Poor $51,383 |
| Immigrants | Jordan | 11.9 /100 | #208 | Poor $51,370 |
| Syrians | 11.4 /100 | #209 | Poor $51,353 |
| Immigrants | Ghana | 10.9 /100 | #210 | Poor $51,333 |
| Irish | 10.6 /100 | #211 | Poor $51,317 |
| Immigrants | Panama | 9.7 /100 | #212 | Tragic $51,278 |
| Dutch | 9.4 /100 | #213 | Tragic $51,265 |
| Zimbabweans | 9.3 /100 | #214 | Tragic $51,259 |
| Icelanders | 9.1 /100 | #215 | Tragic $51,247 |
| French | 8.7 /100 | #216 | Tragic $51,230 |
| Czechoslovakians | 8.6 /100 | #217 | Tragic $51,224 |
| Immigrants | Belize | 8.6 /100 | #218 | Tragic $51,223 |
| Arabs | 8.5 /100 | #219 | Tragic $51,219 |
| Immigrants | Germany | 8.0 /100 | #220 | Tragic $51,190 |
Demographics Similar to Chinese by Householder Income Under 25 years
In terms of householder income under 25 years, the demographic groups most similar to Chinese are Indian (Asian) ($58,239, a difference of 0.13%), Afghan ($58,019, a difference of 0.25%), Immigrants from China ($57,931, a difference of 0.40%), Immigrants from Philippines ($57,930, a difference of 0.40%), and Bolivian ($58,506, a difference of 0.59%).
| Demographics | Rating | Rank | Householder Income Under 25 years |
| Immigrants | Hong Kong | 100.0 /100 | #2 | Exceptional $62,083 |
| Immigrants | India | 100.0 /100 | #3 | Exceptional $59,914 |
| Immigrants | Taiwan | 100.0 /100 | #4 | Exceptional $59,424 |
| Immigrants | Bolivia | 100.0 /100 | #5 | Exceptional $59,389 |
| Thais | 100.0 /100 | #6 | Exceptional $59,187 |
| Bolivians | 100.0 /100 | #7 | Exceptional $58,506 |
| Indians (Asian) | 100.0 /100 | #8 | Exceptional $58,239 |
| Chinese | 100.0 /100 | #9 | Exceptional $58,162 |
| Afghans | 100.0 /100 | #10 | Exceptional $58,019 |
| Immigrants | China | 100.0 /100 | #11 | Exceptional $57,931 |
| Immigrants | Philippines | 100.0 /100 | #12 | Exceptional $57,930 |
| Immigrants | South Central Asia | 100.0 /100 | #13 | Exceptional $57,818 |
| Filipinos | 100.0 /100 | #14 | Exceptional $57,740 |
| Koreans | 100.0 /100 | #15 | Exceptional $57,730 |
| Immigrants | Afghanistan | 100.0 /100 | #16 | Exceptional $57,478 |