Dominican vs Asian Householder Income Over 65 years
COMPARE
Dominican
Asian
Householder Income Over 65 years
Householder Income Over 65 years Comparison
Dominicans
Asians
$46,964
HOUSEHOLDER INCOME OVER 65 YEARS
0.0/ 100
METRIC RATING
341st/ 347
METRIC RANK
$68,822
HOUSEHOLDER INCOME OVER 65 YEARS
100.0/ 100
METRIC RATING
32nd/ 347
METRIC RANK
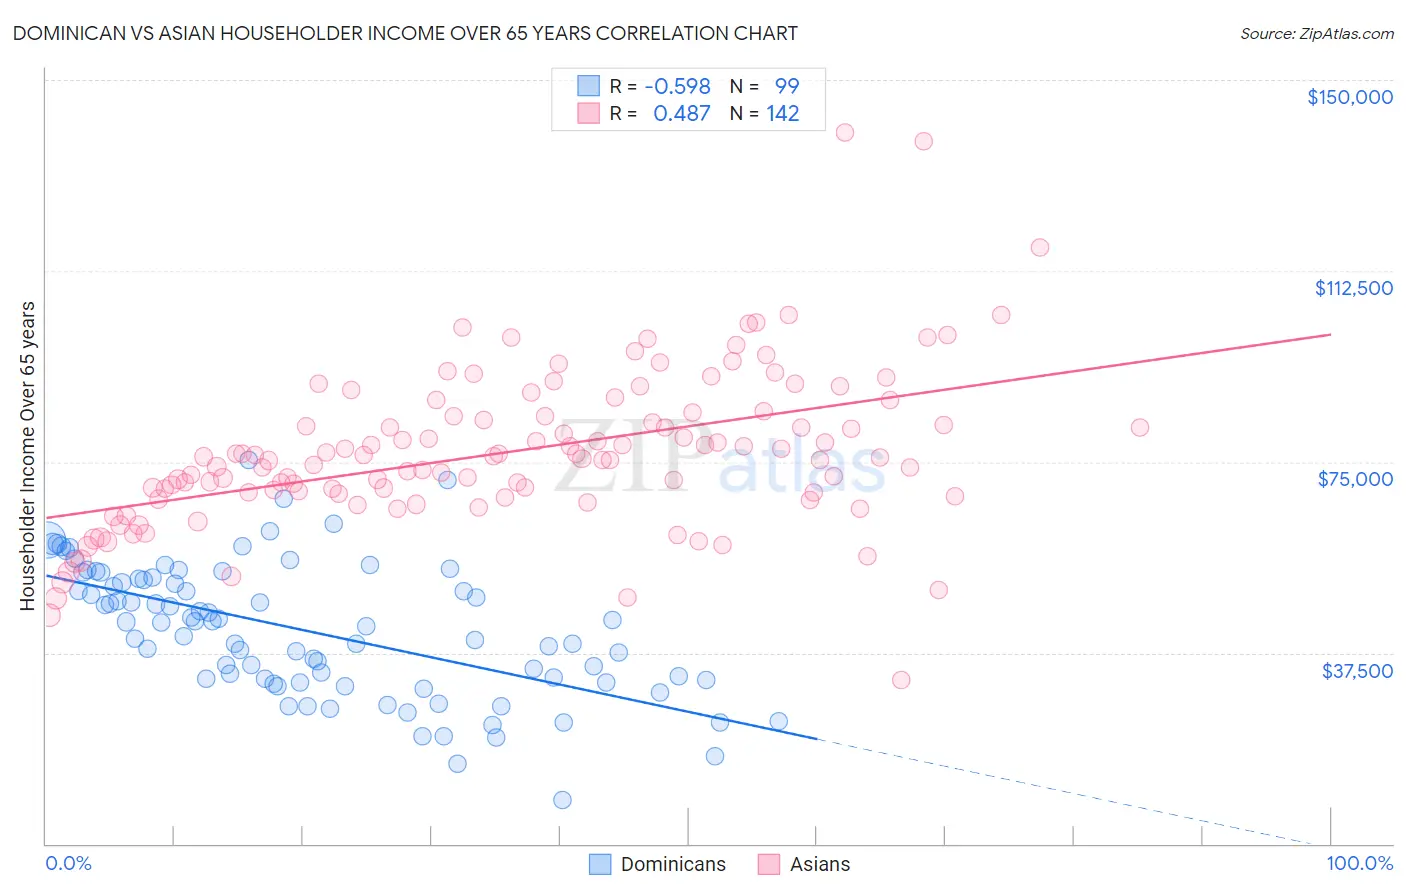
Dominican vs Asian Householder Income Over 65 years Correlation Chart
The statistical analysis conducted on geographies consisting of 353,452,286 people shows a substantial negative correlation between the proportion of Dominicans and household income with householder over the age of 65 in the United States with a correlation coefficient (R) of -0.598 and weighted average of $46,964. Similarly, the statistical analysis conducted on geographies consisting of 546,636,612 people shows a moderate positive correlation between the proportion of Asians and household income with householder over the age of 65 in the United States with a correlation coefficient (R) of 0.487 and weighted average of $68,822, a difference of 46.5%.
Householder Income Over 65 years Correlation Summary
| Measurement | Dominican | Asian |
| Minimum | $8,529 | $32,121 |
| Maximum | $75,483 | $139,689 |
| Range | $66,954 | $107,568 |
| Mean | $41,882 | $76,866 |
| Median | $43,498 | $75,680 |
| Interquartile 25% (IQ1) | $32,229 | $68,749 |
| Interquartile 75% (IQ3) | $52,008 | $84,063 |
| Interquartile Range (IQR) | $19,779 | $15,314 |
| Standard Deviation (Sample) | $13,021 | $15,572 |
| Standard Deviation (Population) | $12,955 | $15,517 |
Similar Demographics by Householder Income Over 65 years
Demographics Similar to Dominicans by Householder Income Over 65 years
In terms of householder income over 65 years, the demographic groups most similar to Dominicans are Immigrants from Cabo Verde ($46,654, a difference of 0.66%), Immigrants from Yemen ($47,527, a difference of 1.2%), Navajo ($47,722, a difference of 1.6%), Immigrants from Dominican Republic ($45,758, a difference of 2.6%), and Immigrants from Caribbean ($48,535, a difference of 3.3%).
| Demographics | Rating | Rank | Householder Income Over 65 years |
| Cape Verdeans | 0.0 /100 | #333 | Tragic $50,077 |
| Immigrants | Dominica | 0.0 /100 | #334 | Tragic $50,071 |
| Crow | 0.0 /100 | #335 | Tragic $49,234 |
| Cubans | 0.0 /100 | #336 | Tragic $49,152 |
| Tohono O'odham | 0.0 /100 | #337 | Tragic $49,121 |
| Immigrants | Caribbean | 0.0 /100 | #338 | Tragic $48,535 |
| Navajo | 0.0 /100 | #339 | Tragic $47,722 |
| Immigrants | Yemen | 0.0 /100 | #340 | Tragic $47,527 |
| Dominicans | 0.0 /100 | #341 | Tragic $46,964 |
| Immigrants | Cabo Verde | 0.0 /100 | #342 | Tragic $46,654 |
| Immigrants | Dominican Republic | 0.0 /100 | #343 | Tragic $45,758 |
| Houma | 0.0 /100 | #344 | Tragic $44,822 |
| Immigrants | Cuba | 0.0 /100 | #345 | Tragic $44,735 |
| Puerto Ricans | 0.0 /100 | #346 | Tragic $42,550 |
| Lumbee | 0.0 /100 | #347 | Tragic $40,550 |
Demographics Similar to Asians by Householder Income Over 65 years
In terms of householder income over 65 years, the demographic groups most similar to Asians are Immigrants from Denmark ($68,801, a difference of 0.030%), Afghan ($68,951, a difference of 0.19%), Immigrants from Northern Europe ($69,003, a difference of 0.26%), Immigrants from Ireland ($68,495, a difference of 0.48%), and Immigrants from Australia ($69,164, a difference of 0.50%).
| Demographics | Rating | Rank | Householder Income Over 65 years |
| Immigrants | Belgium | 100.0 /100 | #25 | Exceptional $69,703 |
| Immigrants | Sri Lanka | 100.0 /100 | #26 | Exceptional $69,426 |
| Immigrants | Switzerland | 100.0 /100 | #27 | Exceptional $69,343 |
| Immigrants | China | 100.0 /100 | #28 | Exceptional $69,174 |
| Immigrants | Australia | 100.0 /100 | #29 | Exceptional $69,164 |
| Immigrants | Northern Europe | 100.0 /100 | #30 | Exceptional $69,003 |
| Afghans | 100.0 /100 | #31 | Exceptional $68,951 |
| Asians | 100.0 /100 | #32 | Exceptional $68,822 |
| Immigrants | Denmark | 100.0 /100 | #33 | Exceptional $68,801 |
| Immigrants | Ireland | 100.0 /100 | #34 | Exceptional $68,495 |
| Tongans | 100.0 /100 | #35 | Exceptional $68,235 |
| Immigrants | Austria | 99.9 /100 | #36 | Exceptional $68,208 |
| Turks | 99.9 /100 | #37 | Exceptional $68,037 |
| Estonians | 99.9 /100 | #38 | Exceptional $67,926 |
| Russians | 99.9 /100 | #39 | Exceptional $67,626 |