Dominican vs Guamanian/Chamorro Median Household Income
COMPARE
Dominican
Guamanian/Chamorro
Median Household Income
Median Household Income Comparison
Dominicans
Guamanians/Chamorros
$71,302
MEDIAN HOUSEHOLD INCOME
0.0/ 100
METRIC RATING
314th/ 347
METRIC RANK
$86,255
MEDIAN HOUSEHOLD INCOME
67.7/ 100
METRIC RATING
162nd/ 347
METRIC RANK
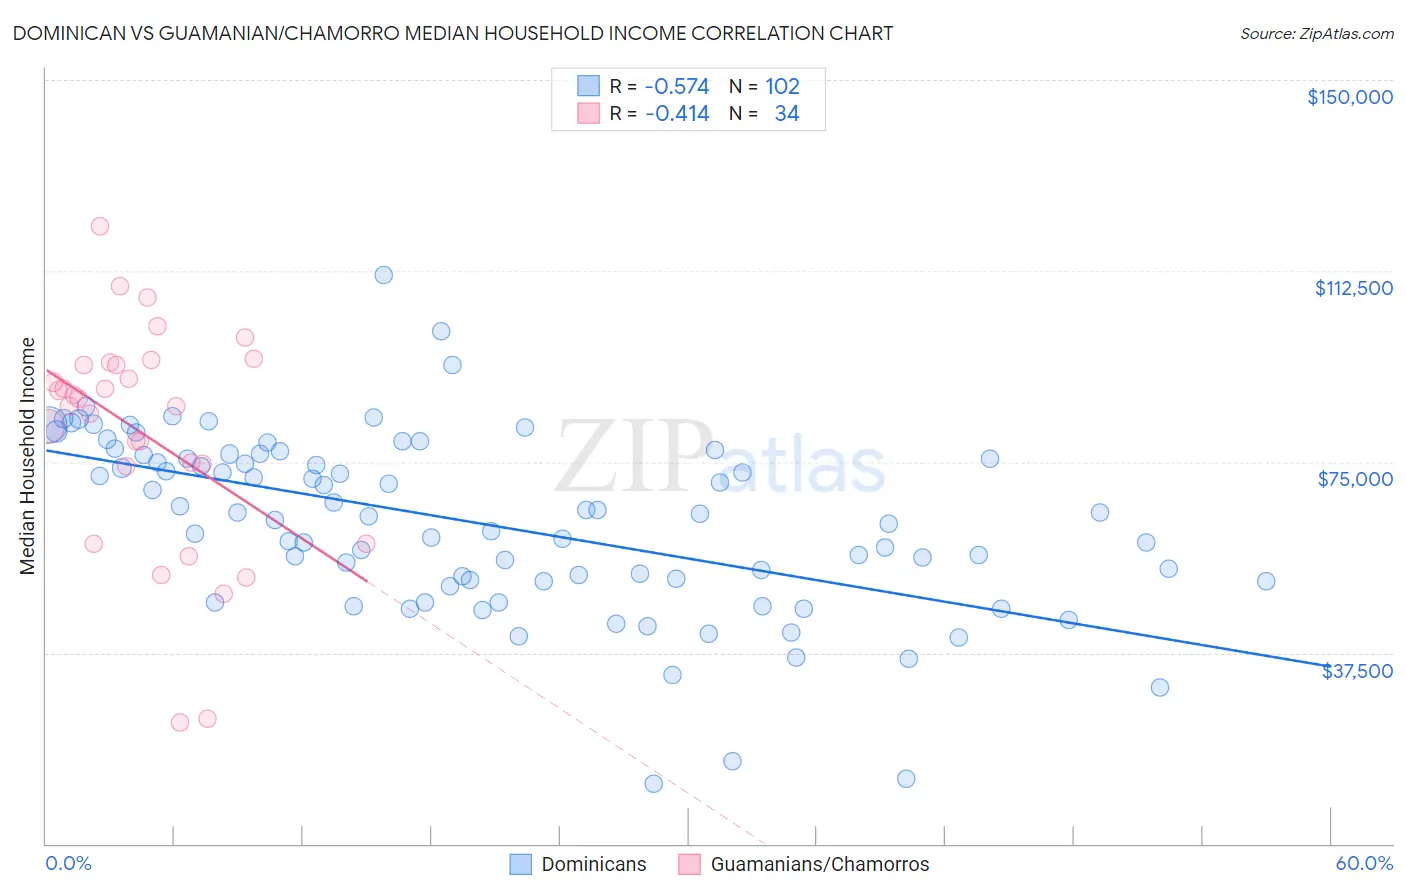
Dominican vs Guamanian/Chamorro Median Household Income Correlation Chart
The statistical analysis conducted on geographies consisting of 354,675,302 people shows a substantial negative correlation between the proportion of Dominicans and median household income in the United States with a correlation coefficient (R) of -0.574 and weighted average of $71,302. Similarly, the statistical analysis conducted on geographies consisting of 221,863,113 people shows a moderate negative correlation between the proportion of Guamanians/Chamorros and median household income in the United States with a correlation coefficient (R) of -0.414 and weighted average of $86,255, a difference of 21.0%.
Median Household Income Correlation Summary
| Measurement | Dominican | Guamanian/Chamorro |
| Minimum | $11,801 | $23,750 |
| Maximum | $111,701 | $121,240 |
| Range | $99,900 | $97,490 |
| Mean | $62,844 | $80,405 |
| Median | $64,590 | $86,640 |
| Interquartile 25% (IQ1) | $51,574 | $74,171 |
| Interquartile 75% (IQ3) | $76,260 | $94,093 |
| Interquartile Range (IQR) | $24,686 | $19,922 |
| Standard Deviation (Sample) | $17,716 | $22,128 |
| Standard Deviation (Population) | $17,629 | $21,800 |
Similar Demographics by Median Household Income
Demographics Similar to Dominicans by Median Household Income
In terms of median household income, the demographic groups most similar to Dominicans are Immigrants from Bahamas ($71,349, a difference of 0.060%), Immigrants from Honduras ($71,452, a difference of 0.21%), Ottawa ($70,984, a difference of 0.45%), Apache ($70,927, a difference of 0.53%), and Immigrants from Zaire ($71,801, a difference of 0.70%).
| Demographics | Rating | Rank | Median Household Income |
| Ute | 0.0 /100 | #307 | Tragic $72,402 |
| Yakama | 0.0 /100 | #308 | Tragic $72,225 |
| Immigrants | Caribbean | 0.0 /100 | #309 | Tragic $71,860 |
| U.S. Virgin Islanders | 0.0 /100 | #310 | Tragic $71,853 |
| Immigrants | Zaire | 0.0 /100 | #311 | Tragic $71,801 |
| Immigrants | Honduras | 0.0 /100 | #312 | Tragic $71,452 |
| Immigrants | Bahamas | 0.0 /100 | #313 | Tragic $71,349 |
| Dominicans | 0.0 /100 | #314 | Tragic $71,302 |
| Ottawa | 0.0 /100 | #315 | Tragic $70,984 |
| Apache | 0.0 /100 | #316 | Tragic $70,927 |
| Cajuns | 0.0 /100 | #317 | Tragic $70,605 |
| Chippewa | 0.0 /100 | #318 | Tragic $70,539 |
| Immigrants | Dominican Republic | 0.0 /100 | #319 | Tragic $70,208 |
| Colville | 0.0 /100 | #320 | Tragic $70,094 |
| Chickasaw | 0.0 /100 | #321 | Tragic $70,005 |
Demographics Similar to Guamanians/Chamorros by Median Household Income
In terms of median household income, the demographic groups most similar to Guamanians/Chamorros are Czech ($86,164, a difference of 0.11%), Irish ($86,145, a difference of 0.13%), Slavic ($86,398, a difference of 0.17%), Luxembourger ($86,418, a difference of 0.19%), and Immigrants from Uzbekistan ($86,425, a difference of 0.20%).
| Demographics | Rating | Rank | Median Household Income |
| Carpatho Rusyns | 72.8 /100 | #155 | Good $86,635 |
| Immigrants | Albania | 71.5 /100 | #156 | Good $86,534 |
| Samoans | 71.0 /100 | #157 | Good $86,498 |
| Moroccans | 70.6 /100 | #158 | Good $86,468 |
| Immigrants | Uzbekistan | 70.1 /100 | #159 | Good $86,425 |
| Luxembourgers | 70.0 /100 | #160 | Good $86,418 |
| Slavs | 69.7 /100 | #161 | Good $86,398 |
| Guamanians/Chamorros | 67.7 /100 | #162 | Good $86,255 |
| Czechs | 66.4 /100 | #163 | Good $86,164 |
| Irish | 66.2 /100 | #164 | Good $86,145 |
| Norwegians | 65.3 /100 | #165 | Good $86,084 |
| Scandinavians | 65.1 /100 | #166 | Good $86,073 |
| Immigrants | Immigrants | 61.3 /100 | #167 | Good $85,818 |
| Icelanders | 61.0 /100 | #168 | Good $85,797 |
| Colombians | 59.7 /100 | #169 | Average $85,716 |