Czech vs Immigrants from Japan Householder Income Over 65 years
COMPARE
Czech
Immigrants from Japan
Householder Income Over 65 years
Householder Income Over 65 years Comparison
Czechs
Immigrants from Japan
$61,244
HOUSEHOLDER INCOME OVER 65 YEARS
57.2/ 100
METRIC RATING
162nd/ 347
METRIC RANK
$69,774
HOUSEHOLDER INCOME OVER 65 YEARS
100.0/ 100
METRIC RATING
23rd/ 347
METRIC RANK
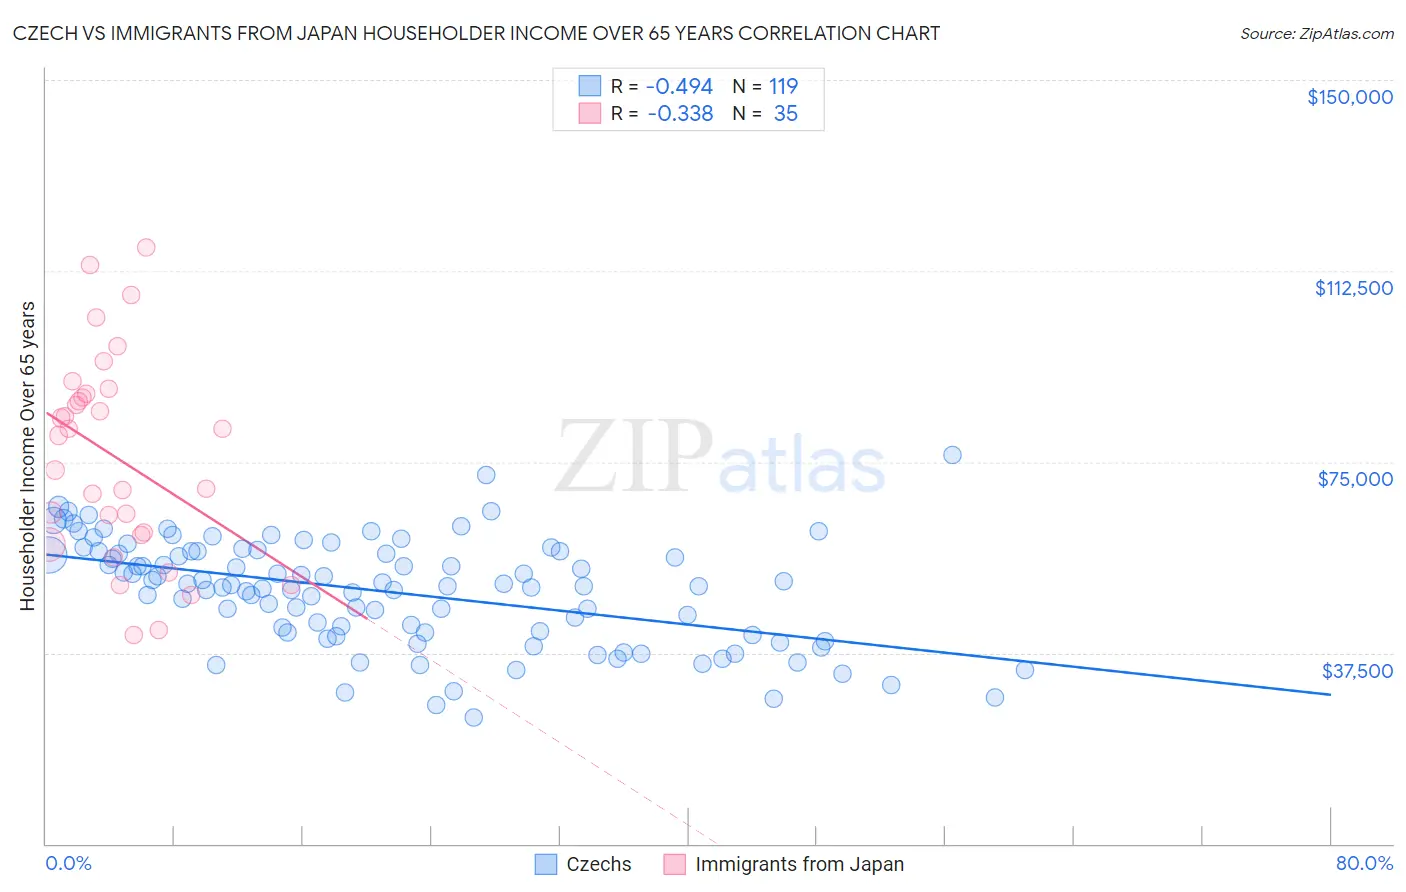
Czech vs Immigrants from Japan Householder Income Over 65 years Correlation Chart
The statistical analysis conducted on geographies consisting of 482,438,211 people shows a moderate negative correlation between the proportion of Czechs and household income with householder over the age of 65 in the United States with a correlation coefficient (R) of -0.494 and weighted average of $61,244. Similarly, the statistical analysis conducted on geographies consisting of 339,138,699 people shows a mild negative correlation between the proportion of Immigrants from Japan and household income with householder over the age of 65 in the United States with a correlation coefficient (R) of -0.338 and weighted average of $69,774, a difference of 13.9%.
Householder Income Over 65 years Correlation Summary
| Measurement | Czech | Immigrants from Japan |
| Minimum | $24,894 | $41,071 |
| Maximum | $76,250 | $117,174 |
| Range | $51,356 | $76,103 |
| Mean | $49,506 | $75,956 |
| Median | $50,665 | $80,209 |
| Interquartile 25% (IQ1) | $41,396 | $60,655 |
| Interquartile 75% (IQ3) | $57,446 | $88,495 |
| Interquartile Range (IQR) | $16,049 | $27,840 |
| Standard Deviation (Sample) | $10,394 | $19,879 |
| Standard Deviation (Population) | $10,351 | $19,593 |
Similar Demographics by Householder Income Over 65 years
Demographics Similar to Czechs by Householder Income Over 65 years
In terms of householder income over 65 years, the demographic groups most similar to Czechs are Icelander ($61,270, a difference of 0.040%), Ugandan ($61,177, a difference of 0.11%), Immigrants from North Macedonia ($61,175, a difference of 0.11%), Immigrants from Ukraine ($61,163, a difference of 0.13%), and Immigrants from Eastern Africa ($61,157, a difference of 0.14%).
| Demographics | Rating | Rank | Householder Income Over 65 years |
| Poles | 65.9 /100 | #155 | Good $61,598 |
| Scandinavians | 65.6 /100 | #156 | Good $61,586 |
| Macedonians | 65.1 /100 | #157 | Good $61,564 |
| English | 63.3 /100 | #158 | Good $61,487 |
| Brazilians | 62.7 /100 | #159 | Good $61,465 |
| Portuguese | 62.1 /100 | #160 | Good $61,440 |
| Icelanders | 57.9 /100 | #161 | Average $61,270 |
| Czechs | 57.2 /100 | #162 | Average $61,244 |
| Ugandans | 55.5 /100 | #163 | Average $61,177 |
| Immigrants | North Macedonia | 55.4 /100 | #164 | Average $61,175 |
| Immigrants | Ukraine | 55.1 /100 | #165 | Average $61,163 |
| Immigrants | Eastern Africa | 55.0 /100 | #166 | Average $61,157 |
| Norwegians | 53.6 /100 | #167 | Average $61,104 |
| Irish | 53.4 /100 | #168 | Average $61,097 |
| Carpatho Rusyns | 53.3 /100 | #169 | Average $61,093 |
Demographics Similar to Immigrants from Japan by Householder Income Over 65 years
In terms of householder income over 65 years, the demographic groups most similar to Immigrants from Japan are Immigrants from Sweden ($69,722, a difference of 0.070%), Immigrants from Belgium ($69,703, a difference of 0.10%), Immigrants from Israel ($69,857, a difference of 0.12%), Immigrants from Eastern Asia ($69,872, a difference of 0.14%), and Immigrants from South Central Asia ($70,103, a difference of 0.47%).
| Demographics | Rating | Rank | Householder Income Over 65 years |
| Okinawans | 100.0 /100 | #16 | Exceptional $70,846 |
| Immigrants | Korea | 100.0 /100 | #17 | Exceptional $70,696 |
| Eastern Europeans | 100.0 /100 | #18 | Exceptional $70,470 |
| Indians (Asian) | 100.0 /100 | #19 | Exceptional $70,238 |
| Immigrants | South Central Asia | 100.0 /100 | #20 | Exceptional $70,103 |
| Immigrants | Eastern Asia | 100.0 /100 | #21 | Exceptional $69,872 |
| Immigrants | Israel | 100.0 /100 | #22 | Exceptional $69,857 |
| Immigrants | Japan | 100.0 /100 | #23 | Exceptional $69,774 |
| Immigrants | Sweden | 100.0 /100 | #24 | Exceptional $69,722 |
| Immigrants | Belgium | 100.0 /100 | #25 | Exceptional $69,703 |
| Immigrants | Sri Lanka | 100.0 /100 | #26 | Exceptional $69,426 |
| Immigrants | Switzerland | 100.0 /100 | #27 | Exceptional $69,343 |
| Immigrants | China | 100.0 /100 | #28 | Exceptional $69,174 |
| Immigrants | Australia | 100.0 /100 | #29 | Exceptional $69,164 |
| Immigrants | Northern Europe | 100.0 /100 | #30 | Exceptional $69,003 |